Physics:K-space (magnetic resonance imaging)
In magnetic resonance imaging (MRI), k-space is the 2D or 3D Fourier transform of the image measured. It was introduced in 1979 by Likes[1] and in 1983 by Ljunggren[2] and Twieg.[3]
In MRI physics, complex values are sampled in k-space during an MR measurement in a premeditated scheme controlled by a pulse sequence, i.e. an accurately timed sequence of radiofrequency and gradient pulses. In practice, k-space often refers to the temporary image space, usually a matrix, in which data from digitized MR signals are stored during data acquisition. When k-space is full (at the end of the scan) the data are mathematically processed to produce a final image. Thus k-space holds raw data before reconstruction.
The concept of k-space is situated in the spatial frequency domain. Thus if we define [math]\displaystyle{ k_\mathrm{FE} }[/math] and [math]\displaystyle{ k_\mathrm{PE} }[/math] such that
- [math]\displaystyle{ k_\mathrm{FE}=\bar{\gamma} G_\mathrm{FE}m\Delta t }[/math]
and
- [math]\displaystyle{ k_\mathrm{PE}=\bar{\gamma} n\Delta G_\mathrm{PE} \tau }[/math]
where FE refers to frequency encoding, PE to phase encoding, [math]\displaystyle{ \Delta t }[/math] is the sampling time (the reciprocal of sampling frequency), [math]\displaystyle{ \tau }[/math] is the duration of GPE, [math]\displaystyle{ \bar{\gamma} }[/math] (gamma bar) is the gyromagnetic ratio, m is the sample number in the FE direction and n is the sample number in the PE direction (also known as partition number), then the 2D-Fourier Transform of this encoded signal results in a representation of the spin density distribution in two dimensions. Thus position (x,y) and spatial frequency ([math]\displaystyle{ k_\mathrm{FE} }[/math], [math]\displaystyle{ k_\mathrm{PE} }[/math]) constitute a Fourier transform pair.
Typically, k-space has the same number of rows and columns as the final image and is filled with raw data during the scan, usually one line per TR (Repetition Time).
An MR image is a complex-valued map of the spatial distribution of the transverse magnetization Mxy in the sample at a specific time point after an excitation. Conventional qualitative interpretation of Fourier Analysis asserts that low spatial frequencies (near the center of k-space) contain the signal to noise and contrast information of the image, whereas high spatial frequencies (outer peripheral regions of k-space) contain the information determining the image resolution. This is the basis for advanced scanning techniques, such as the keyhole acquisition, in which a first complete k-space is acquired, and subsequent scans are performed for acquiring just the central part of the k-space; in this way, different contrast images can be acquired without the need of running full scans.
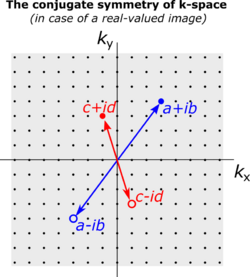
A nice symmetry property exists in k-space if the image magnetization Mxy is prepared to be proportional simply to a contrast-weighted proton density and thus is a real quantity. In such a case, the signal at two opposite locations in k-space is:
- [math]\displaystyle{ S(-k_\mathrm{FE},-k_\mathrm{PE}) = S^*(k_\mathrm{FE},k_\mathrm{PE}) \, }[/math]
where the star ([math]\displaystyle{ ^* }[/math]) denotes complex conjugation. Thus k-space information is somewhat redundant then, and an image can be reconstructed using only one half of the k-space, either in the PE (Phase Encode) direction saving scan time (such a technique is known as half Fourier or half scan) or in the FE (Frequency Encode) direction, allowing for lower sampling frequencies and/or shorter echo times (such a technique is known as half echo). However, these techniques are approximate due to phase errors in the MRI data which can rarely be completely controlled (due to imperfect static field shim, effects of spatially selective excitation, signal detection coil properties, motion etc.) or nonzero phase due to just physical reasons (such as the different chemical shift of fat and water in gradient echo techniques).
MRI k-space is related to NMR time-domain[4] in all aspects, both being used for raw data storage. The only difference between the MRI k-space and the NMR time domain is that a gradient G is present in MRI data acquisition, but is absent in NMR data acquisition. As a result of this difference, the NMR FID signal and the MRI spin-echo signal take different mathematical forms:
- [math]\displaystyle{ \text{FID}=M_\mathrm{0} }[/math]cos[math]\displaystyle{ (\omega_\mathrm{0}t) }[/math]exp[math]\displaystyle{ (-t/T_\mathrm{2}) }[/math]
and
- [math]\displaystyle{ \text{Spin-Echo}= M_\mathrm{0} }[/math]sin[math]\displaystyle{ (\omega_\mathrm{r}t)/(\omega_\mathrm{r}t) }[/math]
where
- [math]\displaystyle{ \omega_\mathrm{r}=\omega_\mathrm{0} + \bar{\gamma} rG }[/math]
Due to the presence of the gradient G, the spatial information r (not the spatial frequency information k) is encoded onto the frequency [math]\displaystyle{ \omega }[/math], and at the same time the time-domain is renamed as k-space.
References
- ↑ Richard S. Likes, "Moving Gradient Zeugmatography", US patent 4307343, issued 1981-12-22, assigned to General Electric Company
- ↑ Ljunggren S. Journal of Magnetic Resonance 1983; 54:338.
- ↑ Twieg D (1983). "The k-trajectory formulation of the NMR imaging process with applications in analysis and synthesis of imaging methods.". Medical Physics 10 (5): 610–21. doi:10.1118/1.595331. PMID 6646065. Bibcode: 1983MedPh..10..610T.
- ↑ Ernst RR, Bodenhausen G and Wokaun A (1987), Principles of nuclear magnetic resonance in one and two dimensions, Oxford University Press.
Further reading
- McRobbie D., et al. MRI, From picture to proton. 2003
- Hashemi Ray, et al. MRI, The Basics 2ED. 2004.


