Software:Adobe Scout
 | |
| Original author(s) | Adobe Systems |
|---|---|
| Developer(s) | Adobe Systems |
| Initial release | January 2013 |
| Stable release | CC 2018 (1.1.3.354121)
/ May 8, 2017 |
| Written in | C++[citation needed] |
| Operating system | Windows, macOS, Android, iOS |
| Platform | x86-64 |
| Type | Multimedia |
| License | Freeware |
| Website | creative |
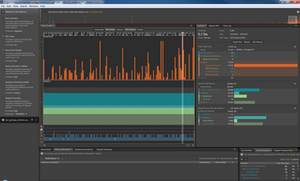
Adobe Scout is a visual profiler for Adobe Flash content running on desktop or mobile platforms, and works together with Adobe Flash Player and Adobe AIR.[1] Scout enables in-depth profiling of ActionScript 3 code execution, 2D graphics and text rendering, and 3D graphics rendered via the Stage3D application programming interface (API).[1]
Scout is the successor of the code profiler introduced in Adobe Flash Builder.[1] Scout was released in January 2013,[2] and provided memory and code execution profiling. Stage3D support was added c. June 2013,[1] along with an integrated Stage3D rendering preview and draw-call recording and replay toolset.
Features
Scout supports profiling of Flash content running on the same machine, or on remote machines, both of which need to connect to Scout via the Telemetry TCP/IP connection.[1] Content on desktop platforms such as Microsoft Windows and Apple OS X may be running in Adobe AIR or Adobe Flash Player. Content on mobile platforms such as Android and iOS may only be profiled if they are running in Adobe AIR for Mobile.
Scout provides code execution metrics, namely the per-frame execution time for ActionScript 3 code, and the memory use by objects created by Flash Player or User code.[1][3] Developers may also track custom events within the Scout interface.[4]
Scout provides historical profiling and a detailed breakup of all central processing unit (CPU) using activities within Flash Player, including code execution (ActionScript), 2D graphics rendering (DisplayList Rendering), network and video, and others.
Scout provides in-depth visual profiling of 3D graphics content rendering with the Stage3D API:
- Stage3D Preview - View the current back-buffer of executed Stage3D Content[1]
- Stage3D Recording - Capture every Stage3D command executed by the Flash content, and replay or step through executed commands[1]
- GPU memory use - Profile texture memory use with a real-time breakdown[1]
- Stage3D Program Editor - Interactively modify recorded Stage3D commands and see what effect this has on rendering. Edit the AGAL code for the vertex and fragment programs executed by each draw call.[1]
References
- ↑ 1.00 1.01 1.02 1.03 1.04 1.05 1.06 1.07 1.08 1.09 Getting started with Adobe Scout, Adobe Developer Connection
- ↑ Understanding Flash Player with Adobe Scout, Adobe Developer Connection
- ↑ Memory profiling with Adobe Scout, Adobe Developer Connection
- ↑ Custom telemetry with Adobe Scout, Adobe Developer Connection
External links
 |
