Software:ChartDirector
 | |
| Developer(s) | Advanced Software Engineering Ltd |
|---|---|
| Stable release | 6.2 / Jan 11, 2018
|
| Written in | C++, Java, .NET(C#), VB, Python |
| Operating system | Windows, Linux, FreeBSD, Mac OS X , Solaris, Java supporting OS |
| Type | List of charting software |
| License | Proprietary |
| Website | http://www.advsofteng.com |
ChartDirector is a charting library for software developers to develop applications that contains charts. ChartDirector is developed by Advanced Software Engineering Ltd.
ChartDirector supports C++ (command line, Qt and MFC), .NET (C#, VB), Java, PHP, Perl, Python, Ruby, COM, VB6, VBA, VBScript and ColdFusion. In terms of operating systems, ChartDirector supports Windows, Linux, FreeBSD, Mac OS X, Solaris as well as any Java supporting operating systems.[1]
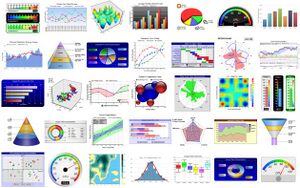
ChartDirector can plot a number of chart types, including pie, donut, bar, line, spline, step line, regression, curve-fitting, inter-line filling, area, band, scatter, bubble, floating box, box-whisker, waterfall, contour, heat map, surface, vector, finance, gantt, radar, polar, rose, pyramid, cone and funnel. It can also draw meters and gauges.[2]
ChartDirector can be used for command line, GUI, as well as web applications. It can output charts to screen as well as in PDF, SVG and images.
History
Advanced Software Engineering Ltd began in 1995 as a software contractor for network management applications, which contained a lot of charts. In 2001, the company decided to package its charting routines into a software library and market it as ChartDirector. Initially a C++ component, ChartDirector has since then been ported to many programming languages and operating systems.[3]
References
