Software:graph (Unix)
| Original author(s) | Douglas McIlroy (AT&T Bell Laboratories) |
|---|---|
| Developer(s) | Various open-source and commercial developers |
| Operating system | Unix, Unix-like |
| Platform | Cross-platform |
| Type | Command |
In Unix, graph is a command-line utility used to draw plots from tabular data.
History
The graph utility, written by Douglas McIlroy, was present in the first version of Unix, and every later version, for instance:
Its output is a sequence of commands for the plot utility, which creates plots using ASCII graphics.
This design demonstrates the Unix philosophy: defining the plot (graph) and drawing it (plot) are separate tools, so they can be recombined with other tools. For instance, plot can be substituted with a different utility, that accepts the same plot commands, but creates the plot in a graphics file format, or sends it to a plotter.
Unix v7 also provided device drivers for plotting the results to various graphics devices; [3] this was announced as now standard.[4]
The GNU plotutils package provides a free non-exact reimplementation, available for Linux and many other systems. It can create plots in various graphics formats.
Usage
In its simplest use, the graph utility takes a textfile containing pairs of numbers, indicating the points of a line plot.
It outputs the line plot. Several options can be supplied to modify its behavior.
Example (Unix)
-
 Preparing example input and running graph with plot
 -
 The results
_demo,_part_1_of_2_-_input_and_execution.png)
_demo,_part_2_of_2_-_output.png)
These screenshots demonstrate basic operation on SunOS 5.10, on which graph and plot come preinstalled. The example input is from the first example in the GNU plotutils manual.
Example (GNU plotutils)
-
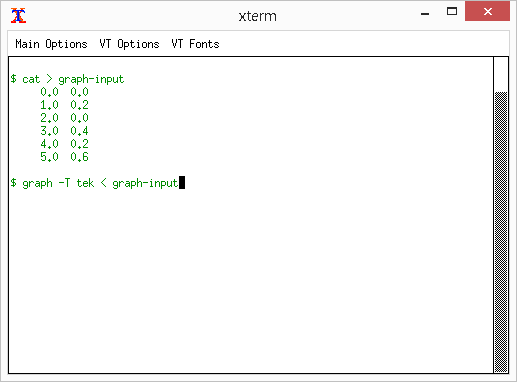 Preparing example input and running graph in Tektronix mode
 -
 The results
_demo,_part_1_of_2_-_input_and_execution.png)
_demo,_part_2_of_2_-_output.png)
These screenshots demonstrate the GNU plotutils version of graph when run in an xterm, exploiting xterm's ability to emulate a Tektronix 4010 plotter.
This demo was run on Ubuntu, which makes GNU plotutils available as an optional package; many other Linux distributions and other Unix-like systems do the same.
References
- ↑ "graph". Bell Labs. 1979. https://www.unix.com/man-page/v7/1G/GRAPH/.
- ↑ "graph". Sun Microsystems. 2005. https://www.unix.com/man-page/sunos/1/graph/.
- ↑ Herrmann, Robert B., ed (2004). Computer programs in Seismology: CALPLOT graphics. p. vi. http://www.eas.slu.edu/eqc/eqc_cps/CPS/CPS330/cps330p.pdf. Retrieved Nov 24, 2018.
- ↑ "7th Edition UNIX — Summary". Murray Hill, New Jersey 07974: Bell Laboratories. September 6, 1978. p. 1. http://a.papnet.eu/UNIX/v7/files/doc/01_summary.pdf.
External links
| File system | |
|---|---|
| Processes | |
| User environment | |
| Text processing | |
| Shell builtins | |
| Searching | |
| Documentation | |
| Software development | |
| Miscellaneous | |
| |
 |  |
