Software:Knitr
 | |
| Original author(s) | Yihui Xie |
|---|---|
| Initial release | Script error: No such module "Date time". |
| Stable release | 1.43
/ 26 May 2023 |
| Written in | R |
| Type | Cross-platform |
| License | GNU GPL |
| Website | yihui |
knitr is an engine for dynamic report generation with R.[1][2] It is a package in the programming language R that enables integration of R code into LaTeX, LyX, HTML, Markdown, AsciiDoc, and reStructuredText documents. The purpose of knitr is to allow reproducible research in R through the means of literate programming. It is licensed under the GNU General Public License.[3]
knitr was inspired by Sweave and written with a different design for better modularization, so it is easier to maintain and extend. Sweave can be regarded as a subset of knitr in the sense that all features of Sweave are also available in knitr. Some of knitr's extensions include the R Markdown format[4] (used in reports published on RPubs[5]), caching, TikZ graphics and support to other languages such as Python, Perl, C++, Shell scripts and CoffeeScript, and so on.
knitr is officially supported in the RStudio IDE for R, LyX, Emacs/ESS and the Architect IDE for data science.
Workflow of knitr
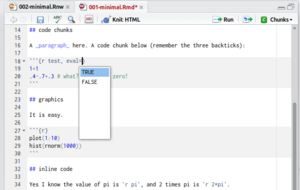
Knitr consists of standard e.g. Markdown document with R-code chunks integrated in the document. The code chunks can be regarded as R-scripts that
- load data,
- performs data processing and
- creates output data (e.g. descriptive analysis) or output graphics (e.g. boxplot diagram).
The implementation of logical conditions in R can provide text elements for the dynamic report depended on the statistical analysis. For example:
   The Wilcoxon Sign test was applied as statistical comparison of the average of two dependent samples above.
   In this case, the calculated P-value was 0.56 and hence greater than the significance level (0.05 by default).
   This implies that "H0: there is no difference between the results in data1 and data2" cannot be rejected.
The text fragments are selected according to the script's results. In this example, if the P-value was lower than the significance level, different text fragments would be inserted in the dynamic report. In particular, the second sentence would swap "less" for "greater," and the third sentence would be replaced to reflect rejection of the null hypothesis. Using this workflow allows creating new reports simply by supplying new input data, ensuring the methodology is reproduced identically.
See also
- The R Programming wikibook
- Reproducible research
References
- ↑ Xie, Yihui (2015). Dynamic Documents with R and knitr, 2nd Edition. Chapman & Hall/CRC. ISBN 9781498716963. http://www.crcpress.com/product/isbn/9781498716963.
- ↑ Xie, Yihui. "knitr: A General-Purpose Tool for Dynamic Report Generation in R". https://github.com/yihui/knitr/releases/download/doc/knitr-manual.pdf.
- ↑ "Knitr: A General-Purpose Package for Dynamic Report Generation in R". 29 September 2021. https://cran.r-project.org/package=knitr.
- ↑ RStudio, Inc. "R Markdown — Dynamic Documents for R". http://rmarkdown.rstudio.com.
- ↑ RStudio, Inc. "Easy web publishing from R". http://www.rpubs.com/.
External links
- Repository on GitHub
- Example code on GitHub
- knitr package on CRAN
 |
