Software:RRDtool
 | |
| Original author(s) | Tobias Oetiker |
|---|---|
| Initial release | July 16, 1999 |
| Written in | C |
| License | GNU General Public License |
| Website | oss |

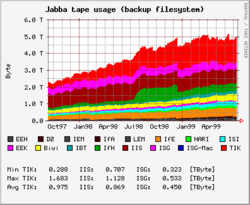
RRDtool (round-robin database tool) is a data logging and graphing system for time series data. It aims to handle time series data such as network bandwidth, temperatures or CPU load. The data is stored in a circular buffer based database, thus the system storage footprint remains constant over time.
It also includes tools to extract round-robin data in a graphical format, for which it was originally intended. Bindings exist for several programming languages, e.g. Perl, Python, Ruby, Tcl, PHP and Lua. There is an independent full Java implementation called rrd4j.
General data storage
RRDtool assumes time-variable data in intervals of a certain length. This interval, usually named step, is specified upon creation of an RRD file and cannot be changed afterwards. Because data may not always be available at just the right time, RRDtool will automatically interpolate any submitted data to fit its internal time-steps.
The value for a specific step, that has been interpolated, is named a primary data point (PDP). Multiple PDPs may be consolidated according to a consolidation function (CF) to form a consolidated data point (CDP). Typical consolidation functions are average, minimum, maximum.
After the data has been consolidated, the resulting CDP is stored in a round-robin archive (RRA). A round-robin archive stores a fixed number of CDPs and specifies how many PDPs should be consolidated into one CDP and which CF to use. The total time covered by an RRA can be calculated as follows:
- time covered = (#CDPs stored) × (#PDPs per CDP) × (step time length)
After this time the archive will "wrap around": the next insertion will overwrite the oldest entry. This behavior in this context is referred to as "round-robin" and is the reason for the program's name. However this is different from the common computer science definition, which is a method of distributing resources among multiple consumers or processes.
To cover several timespans and/or use several consolidation functions, an RRD file may contain multiple RRAs. The data retrieval function of RRDtool automatically selects the archive with the highest resolution that still covers the requested timespan. This mechanism is also used by RRDtool's graphing subsystem.
Release history
| Colour | Meaning |
|---|---|
| Red | Release no longer supported |
| Green | Release still supported |
| Blue | Future release |
The following table contains the release history of RRDtool, showing its major releases.
| Version number | Date | Links | Notable changes |
|---|---|---|---|
| 1.0 | July 16, 1999 | Full release notes, Announce | First release. Basically MRTG "done right". |
| 1.1 | April 25, 2005 | Full release notes, Announce | libart; output EPS, PDF & SVG; VDEF; trends; percentiles; updatev; Holt-Winters Forecasting; COMPUTE; .rrd format change. |
| 1.3 | June 11, 2008 | Full release notes, Announce | Safer & faster file access; cairo/pango; anti-aliasing; TEXTALIGN; dashed lines; new HWPREDICT; libxml; i18n; XML dump; |
| 1.4 | October 27, 2009 | Full release notes, Announce | Caching daemon; VDEF PERCENTNAN; CDEF PREDICT & PREDICTSIGMA; libDBI; graph legends positioning; Lua bindings; 3D border width; and more ... |
| 1.5 | April 16, 2015 | Full release notes, Announce | Use data from callback functions; Population of new rrd files with data from old ones; .NET bindings |
| 1.6 | May 9, 2016 | Full release notes, Announce | Thread Safety |
| 1.7 | May 17, 2017 | Full release notes | Results of code audit; overhaul of the Python bindings; various other small feature improvements |
| 1.8 | March 13, 2022 | Full release notes | ROUND function for rrd RPN, vcpkg support for MSVC builds, first_weekday for Windows port, x64 platform for win32 build, --add-jsontime for graphv, add --utc to graph, automated testing for win32 builds, support TUNE command in rrdcached |
| 1.9 | July 29, 2024 | Full release notes | Configurable locking. |
Other tools that use RRDtool as a DBMS and/or graphing subsystem
See also
References
External links
- No URL found. Please specify a URL here or add one to Wikidata.
 |
