Physics:Capillary pressure
In fluid statics, capillary pressure ([math]\displaystyle{ {p_c} }[/math]) is the pressure between two immiscible fluids in a thin tube (see capillary action), resulting from the interactions of forces between the fluids and solid walls of the tube. Capillary pressure can serve as both an opposing or driving force for fluid transport and is a significant property for research and industrial purposes (namely microfluidic design and oil extraction from porous rock). It is also observed in natural phenomena.
Definition
Capillary pressure is defined as:
- [math]\displaystyle{ p_c=p_{\text{non-wetting phase}}-p_{\text{wetting phase}} }[/math]
where:
- [math]\displaystyle{ p_{\text{c}} }[/math]is the capillary pressure
- [math]\displaystyle{ p_{\text{non-wetting phase}} }[/math] is the pressure of the non-wetting phase
- [math]\displaystyle{ p_{\text{wetting phase}} }[/math] is the pressure of the wetting phase
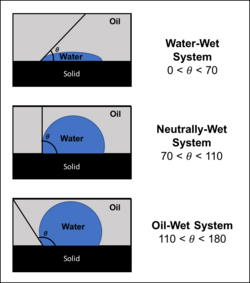
The wetting phase is identified by its ability to preferentially diffuse across the capillary walls before the non-wetting phase. The "wettability" of a fluid depends on its surface tension, the forces that drive a fluid's tendency to take up the minimal amount of space possible, and it is determined by the contact angle of the fluid.[1] A fluid's "wettability" can be controlled by varying capillary surface properties (e.g. roughness, hydrophilicity). However, in oil-water systems, water is typically the wetting phase, while for gas-oil systems, oil is typically the wetting phase.[1] Regardless of the system, a pressure difference arises at the resulting curved interface between the two fluids.[2]
Equations
Capillary pressure formulas are derived from the pressure relationship between two fluid phases in a capillary tube in equilibrium, which is that force up = force down. These forces are described as:[1]
- [math]\displaystyle{ {\text{force up = interfacial tension of the fluid(s) acting along the perimeter of the capillary tube}} }[/math]
- [math]\displaystyle{ {\text{force down = (density gradient difference) x (cross-sectional area) x (height of the capillary rise in the tube)}} }[/math]
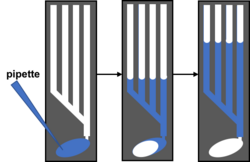
These forces can be described by the interfacial tension and contact angle of the fluids, and the radius of the capillary tube. An interesting phenomena, capillary rise of water (as pictured to the right) provides a good example of how these properties come together to drive flow through a capillary tube and how these properties are measured in a system. There are two general equations that describe the force up and force down relationship of two fluids in equilibrium.
The Young–Laplace equation is the force up description of capillary pressure, and the most commonly used variation of the capillary pressure equation:[2][1]
- [math]\displaystyle{ p_c=\frac{2\gamma \cos \theta}{r_c} }[/math]
where:
- [math]\displaystyle{ \gamma }[/math] is the interfacial tension
- [math]\displaystyle{ r }[/math] is the effective radius of the interface
- [math]\displaystyle{ \theta }[/math] is the wetting angle of the liquid on the surface of the capillary
The force down formula for capillary pressure is seen as:[1]
- [math]\displaystyle{ p_c=\frac{\pi r^2 h (\Gamma_w-\Gamma_{nw})}{\pi r^2}=h(\Gamma_w-\Gamma_{nw}) }[/math]
where:
- [math]\displaystyle{ h }[/math] is the height of the capillary rise
- [math]\displaystyle{ \Gamma_w }[/math] is the density gradient of the wetting phase
- [math]\displaystyle{ \Gamma_{nw} }[/math] is the density gradient of the non-wetting phase
Applications
Microfluidics
Microfluidics is the study and design of the control or transport of small volumes of fluid flow through porous material or narrow channels for a variety of applications (e.g. mixing, separations). Capillary pressure is one of many geometry-related characteristics that can be altered in a microfluidic device to optimize a certain process. For instance, as the capillary pressure increases, a wettable surface in a channel will pull the liquid through the conduit. This eliminates the need for a pump in the system, and can make the desired process completely autonomous. Capillary pressure can also be utilized to block fluid flow in a microfluidic device.
The capillary pressure in a microchannel can be described as:
- [math]\displaystyle{ p_c=-\gamma\left(\frac{cos\theta_b+cos\theta_t}{d}+\frac{cos\theta_l+cos\theta_r}{w}\right) }[/math]
where:
- [math]\displaystyle{ {\gamma} }[/math] is the surface tension of the liquid
- [math]\displaystyle{ {\theta_b} }[/math] is the contact angle at the bottom
- [math]\displaystyle{ {\theta_t} }[/math] is the contact angle at the top
- [math]\displaystyle{ {\theta_l} }[/math] is the contact angle at the left side of the channel
- [math]\displaystyle{ {\theta_r} }[/math] is the contact angles at the right side of the channel
- [math]\displaystyle{ {d} }[/math] is the depth
- [math]\displaystyle{ {w} }[/math] is the width
Thus, the capillary pressure can be altered by changing the surface tension of the fluid, contact angles of the fluid, or the depth and width of the device channels. To change the surface tension, one can apply a surfactant to the capillary walls. The contact angles vary by sudden expansion or contraction within the device channels. A positive capillary pressure represents a valve on the fluid flow while a negative pressure represents the fluid being pulled into the microchannel.[3]
Measurement Methods
Methods for taking physical measurements of capillary pressure in a microchannel have not been thoroughly studied, despite the need for accurate pressure measurements in microfluidics. The primary issue with measuring the pressure in microfluidic devices is that the volume of fluid is too small to be used in standard pressure measurement tools. Some studies have presented the use of microballoons, which are size-changing pressure sensors. Servo-nulling, which is historically used for measuring blood pressure, has also been demonstrated to provide pressure information in microfluidic channels with the assistance of a LabVIEW control system. Essentially, a micropipette is immersed in the microchannel fluid and is programmed to respond to changes in the fluid meniscus. A displacement in the meniscus of the fluid in the micropipette induces a voltage drop, which triggers a pump to restore the original position of the meniscus. The pressure exerted by the pump is interpreted as the pressure within the microchannel.[4]
Examples
Current research in microfluidics is focused on developing point-of-care diagnostics and cell sorting techniques (see lab-on-a-chip), and understanding cell behavior (e.g. cell growth, cell aging). In the field of diagnostics, the lateral flow test is a common microfluidic device platform that utilizes capillary forces to drive fluid transport through a porous membrane. The most famous lateral flow test is the take home pregnancy test, in which bodily fluid initially wets and then flows through the porous membrane, often cellulose or glass fiber, upon reaching a capture line to indicate a positive or negative signal. An advantage to this design, and several other microfluidic devices, is its simplicity (for example, its lack of human intervention during operation) and low cost. However, a disadvantage to these tests is that capillary action cannot be controlled after it has started, so the test time cannot be sped up or slowed down (which could pose an issue if certain time-dependent processes are to take place during the fluid flow).[5]
Another example of point-of-care work involving a capillary pressure-related design component is the separation of plasma from whole blood by filtration through porous membrane. Efficient and high-volume separation of plasma from whole blood is often necessary for infectious disease diagnostics, like the HIV viral load test. However, this task is often performed through centrifugation, which is limited to clinical laboratory settings. An example of this point-of-care filtration device is a packed-bed filter, which has demonstrated the ability to separate plasma and whole blood by utilizing asymmetric capillary forces within the membrane pores.[6]
Petrochemical industry
Capillary pressure plays a vital role in extracting sub-surface hydrocarbons (such as petroleum or natural gas) from underneath porous reservoir rocks. Its measurements are utilized to predict reservoir fluid saturations and cap-rock seal capacity, and for assessing relative permeability (the ability of a fluid to be transported in the presence of a second immiscible fluid) data.[7] Additionally, capillary pressure in porous rocks has been shown to affect phase behavior of the reservoir fluids, thus influencing extraction methods and recovery.[8] It is crucial to understand these geological properties of the reservoir for its development, production, and management (e.g. how easy it is to extract the hydrocarbons).
The Deepwater Horizon oil spill is an example of why capillary pressure is significant to the petrochemical industry. It is believed that upon the Deepwater Horizon oil rig’s explosion in the Gulf of Mexico in 2010, methane gas had broken through a recently implemented seal, and expanded up and out of the rig. Although capillary pressure studies (or potentially a lack thereof) do not necessarily sit at the root of this particular oil spill, capillary pressure measurements yield crucial information for understanding reservoir properties that could have influenced the engineering decisions made in the Deepwater Horizon event.[9]
Capillary pressure, as seen in petroleum engineering, is often modeled in a laboratory where it is recorded as the pressure required to displace some wetting phase by a non-wetting phase to establish equilibrium.[10] For reference, capillary pressures between air and brine (which is a significant system in the petrochemical industry) have been shown to range between 0.67 and 9.5 MPa.[11] There are various ways to predict, measure, or calculate capillary pressure relationships in the oil and gas industry. These include the following:[7]
Leverett J-function
The Leverett J-function serves to provide a relationship between the capillary pressure and the pore structure (see Leverett J-function).
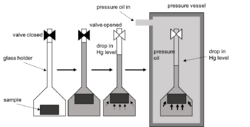
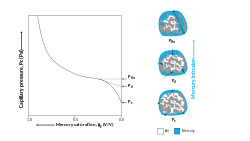
Mercury Injection
This method is well suited to irregular rock samples (e.g. those found in drill cuttings) and is typically used to understand the relationship between capillary pressure and the porous structure of the sample.[12] In this method, the pores of the sample rock are evacuated, followed by mercury filling the pores with increasing pressure. Meanwhile, the volume of mercury at each given pressure is recorded and given as a pore size distribution, or converted to relevant oil/gas data. One pitfall to this method is that it does not account for fluid-surface interactions. However, the entire process of injecting mercury and collecting data occurs rapidly in comparison to other methods.[7]
Porous Plate Method
The Porous Plate Method is an accurate way to understand capillary pressure relationships in fluid-air systems. In this process, a sample saturated with water is placed on a flat plate, also saturated with water, inside a gas chamber. Gas is injected at increasing pressures, thus displacing the water through the plate. The pressure of the gas represents the capillary pressure, and the amount of water ejected from the porous plate is correlated to the water saturation of the sample.[7]
Centrifuge Method
The centrifuge method relies on the following relationship between capillary pressure and gravity:[7]
- [math]\displaystyle{ p_c=hg(\rho_w-\rho_{nw}) }[/math]
where:
- [math]\displaystyle{ h }[/math] is the height of the capillary rise
- [math]\displaystyle{ g }[/math] is gravity
- [math]\displaystyle{ \rho_w }[/math] is the density of the wetting phase
- [math]\displaystyle{ \rho_{nw} }[/math] is the density of the non-wetting phase
The centrifugal force essentially serves as an applied capillary pressure for small test plugs, often composed of brine and oil. During the centrifugation process, a given amount of brine is expelled from the plug at certain centrifugal rates of rotation. A glass vial measures the amount of fluid as it is being expelled, and these readings result in a curve that relates rotation speeds with drainage amounts. The rotation speed is correlated to capillary pressure by the following equation:
- [math]\displaystyle{ p_c=7.9e^{-8}(\rho_1-\rho_2)\omega^2(r_b^2-r_t^2) }[/math]
where:
- [math]\displaystyle{ r_b }[/math] is the radius of rotation of the bottom of the core sample
- [math]\displaystyle{ r_t }[/math] is the radius of rotation of the top of the core sample
- [math]\displaystyle{ \omega }[/math] is the rotational speed
The primary benefits to this method are that it's rapid (producing curves in a matter of hours) and is not restricted to being performed at certain temperatures.[13]
Other methods include the Vapor Pressure Method, Gravity-Equilibrium Method, Dynamic Method, Semi-dynamic Method, and the Transient Method.
Correlations
In addition to measuring the capillary pressure in a laboratory setting to model that of an oil/natural gas reservoir, there exist several relationships to describe the capillary pressure given specific rock and extraction conditions. For example, R. H. Brooks and A. T. Corey developed a relationship for capillary pressure during the drainage of oil from an oil-saturated porous medium experiencing a gas invasion:[14]
- [math]\displaystyle{ p_{cgo}=p_t(\frac{1-S_{or}}{S_o-S_{or}})^{(1/\lambda)} }[/math]
where:
- [math]\displaystyle{ P_{cgo} }[/math] is the capillary pressure between oil and gas phases
- [math]\displaystyle{ S_o }[/math] is the oil saturation
- [math]\displaystyle{ S_{or} }[/math] is the residual oil saturation that remains trapped in the pore at high capillary pressure
- [math]\displaystyle{ P_t }[/math] is the threshold pressure (the pressure at which the gas phase is allowed to flow)
- [math]\displaystyle{ \lambda }[/math] is a parameter that is related to the distribution of pore sizes
- [math]\displaystyle{ \lambda\gt 2 }[/math] for narrow distributions
- [math]\displaystyle{ \lambda\lt 2 }[/math] for wide distributions
Additionally, R. G. Bentsen and J. Anli developed a correlation for the capillary pressure during the drainage from a porous rock sample in which an oil phase displaces saturated water:[15]
- [math]\displaystyle{ p_{cow}=p_t-p_{cs}ln(\frac{S_w-S_{wi}}{1-S_{wi}}) }[/math]
where:
- [math]\displaystyle{ P_{cow} }[/math] is the capillary pressure between oil and water phases
- [math]\displaystyle{ P_{cs} }[/math] is a parameter that controls the shape of the capillary pressure function
- [math]\displaystyle{ (\frac{S_w-S_{wi}}{1-S_{wi}}) }[/math] is the normalized wetting-phase saturation
- [math]\displaystyle{ S_w }[/math] is the saturation of the wetting phase
- [math]\displaystyle{ S_{wi} }[/math] is the irreducible wetting-phase saturation
Averaging capillary pressure vs. water saturation curves
It has been shown that as reservoir simulators use the primary drainage capillary pressure data for saturation-height modeling calculations, primary drainage capillary pressure data should be averaged in the same manner that water saturations are averaged. Also, as reservoir simulators use the imbibition and secondary drainage capillary pressure data for fluids displacement calculations, these capillary pressures should not be averaged like primary drainage capillary pressure data. These can be averaged by Leverett J-function. The averaging equations are as follows [16]
averaging primary drainage capillary pressure vs. normalized saturation data
- [math]\displaystyle{ \text{average Pc} = \frac{\sum_{i=1}^n\left({\phi V_{\mathit{b}} P_{\mathit{c}}}\right)_i}{\sum_{i=1}^n\left({\phi V_{\mathit{b}} }\right)_i} }[/math]
in which [math]\displaystyle{ n }[/math] is the number of core samples, [math]\displaystyle{ \phi }[/math] is the effective porosity, [math]\displaystyle{ Vb }[/math] is the bulk volume of sample, and [math]\displaystyle{ Pc }[/math] is the primary drainage capillary pressure data vs. normalized water saturation.
averaging imbibition and secondary drainage capillary pressure vs. normalized saturation data
- [math]\displaystyle{ \text{average Pc} = \frac{\sum_{i=1}^n\left(\frac{P_{\mathit{c}} \sqrt{k/\phi} }{\gamma}\right)_i}{\sum_{i=1}^n\left(\frac{\sqrt{k/\phi}}{\gamma}\right)_i} }[/math]
in which [math]\displaystyle{ n }[/math] is the number of core samples, [math]\displaystyle{ \phi }[/math] is the effective porosity, [math]\displaystyle{ k }[/math] is the absolute permeability, [math]\displaystyle{ \gamma }[/math] is the interfacial tension or IFT, and [math]\displaystyle{ Pc }[/math] is the imbibition or secondary drainage capillary pressure data vs. normalized water saturation.
In nature
Needle ice
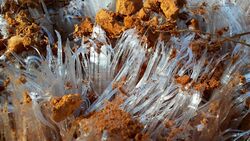
In addition to being manipulated for medical and energy applications, capillary pressure is the cause behind various natural phenomena as well. For example, needle ice, seen in cold soil, occurs via capillary action. The first major contributions to the study of needle ice, or simply, frost heaving were made by Stephen Taber (1929) and Gunnar Beskow (1935), who independently aimed to understand soil freezing. Taber’s initial work was related to understanding how the size of pores within the ground influenced the amount of frost heave. He also discovered that frost heave is favorable for crystal growth and that a gradient of soil moisture tension drives water upward toward the freezing front near the top of the ground.[17] In Beskow’s studies, he defined this soil moisture tension as “capillary pressure” (and soil water as “capillary water”). Beskow determined that the soil type and effective stress on the soil particles influenced frost heave, where effective stress is the sum of pressure from above ground and the capillary pressure.[18]
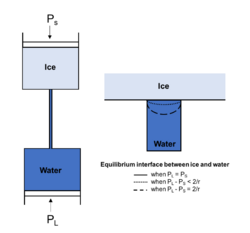
In 1961, D.H. Everett elaborated on Taber and Beskow’s studies to understand why pore spaces filled with ice continue to experience ice growth. He utilized thermodynamic equilibrium principles, a piston cylinder model for ice growth and the following equation to understand the freezing of water in porous media (directly applicable to the formation of needle ice):
- [math]\displaystyle{ P_s-P_l=\Psi_{sl}\frac{dA_r}{dV}=\Psi_{sl}\tilde{K} }[/math]
where:
- [math]\displaystyle{ {P_s} }[/math] is the pressure of the solid crystal
- [math]\displaystyle{ {P_l} }[/math] is the pressure in the surrounding liquid
- [math]\displaystyle{ {\Psi_{sl}} }[/math] is the interfacial tension between the solid and the liquid
- [math]\displaystyle{ {A_r} }[/math] is the surface area of the phase boundary
- [math]\displaystyle{ {V} }[/math] is the volume of the crystal
- [math]\displaystyle{ \tilde{K} }[/math] is the mean curvature of the solid/liquid interface
With this equation and model, Everett noted the behavior of water and ice given different pressure conditions at the solid-liquid interface. Everett determined that if the pressure of the ice is equal to the pressure of the liquid underneath the surface, ice growth is unable to continue into the capillary. Thus, with additional heat loss, it is most favorable for water to travel up the capillary and freeze in the top cylinder (as needle ice continues to grow atop itself above the soil surface). As the pressure of the ice increases, a curved interface between the solid and liquid arises and the ice will either melt, or equilibrium will be reestablished so that further heat loss again leads to ice formation. Overall, Everett determined that frost heaving (analogous to the development of needle ice) occurs as a function of the pore size in the soil and the energy at the interface of ice and water. Unfortunately, the downside to Everett's model is that he did not consider soil particle effects on the surface.[19][20]
Circulatory system
Capillaries in the circulatory system are vital to providing nutrients and excreting waste throughout the body. There exist pressure gradients (due to hydrostatic and oncotic pressures) in the capillaries that control blood flow at the capillary level, and ultimately influence the capillary exchange processes (e.g. fluid flux).[21] Due to limitations in technology and bodily structure, most studies of capillary activity are done in the retina, lip and skin, historically through cannulation or a servo-nulling system. Capillaroscopy has been used to visualize capillaries in the skin in 2D, and has been reported to observe an average range of capillary pressure of 10.5 to 22.5 mmHg in humans, and an increase in pressure among people with type 1 diabetes and hypertension. Relative to other components of the circulatory system, capillary pressure is low, as to avoid rupturing, but sufficient for facilitating capillary functions.[22]
See also
- Capillary action
- Capillary number
- Disjoining pressure
- Leverett J-function
- Young–Laplace equation
- Laplace pressure
- Surface tension
- Microfluidics
- Water retention curve
- TEM-function
- USBM wettability index
References
- ↑ 1.0 1.1 1.2 1.3 1.4 Fanchi, John R.. (2006). Principles of Applied Reservoir Simulation (3rd Edition). Elsevier.
- ↑ 2.0 2.1 Tiab, Donaldson, Djebbar, Erle C. (2004). Petrophysics - Theory and Practice of Measuring Reservoir Rock and Fluid Transport Properties (2nd ed.).
- ↑ Junker, D. (2002). Capillary Microfluidic Systems for Bio/Chemistry.
- ↑ Grundmann, Clavica, Landolt, Barrett, Weber, Obrist, A, F, A, M, B, D (October 25, 2015). "MEASUREMENT OF FLUID PRESSURE IN MICROCHANNELS". International Conference on Miniaturized Systems for Chemistry and Life Sciences.
- ↑ Sajida, Kawdea, Daudc, Muhammad, Abdel-Nasser, Muhammad (2015). "Designs, formats and applications of lateral flow assay: A literature review". Journal of Saudi Chemical Society 19 (6): 689–705. doi:10.1016/j.jscs.2014.09.001.
- ↑ Lee, Ahn, KK, CH (2013). "A new on-chip whole blood/plasma separator driven by asymmetric capillary forces". Lab on a Chip 13 (16): 3261–7. doi:10.1039/c3lc50370d. PMID 23793507.
- ↑ 7.0 7.1 7.2 7.3 7.4 Glover, Paul. Formation Evaluation MSc Course Notes. pp. 84–94.
- ↑ Nojabaei, Siripatrachai, Johns, Ertekin, B, N, RT, T (November 2016). "Effect of large gas-oil capillary pressure on production: A compositionally-extended black oil formulation". Journal of Petroleum Science and Engineering 147: 317–329. doi:10.1016/j.petrol.2016.05.048.
- ↑ Pallardy, Richard (May 9, 2016). "Deepwater Horizon oil spill of 2010". https://www.britannica.com/event/Deepwater-Horizon-oil-spill-of-2010.
- ↑ Tiab, Djebbar Donaldson, Erle C.. (2004). Petrophysics - Theory and Practice of Measuring Reservoir Rock and Fluid Transport Properties (2nd Edition). Elsevier.
- ↑ Melrose, J. C. (1990, February 1). Valid Capillary Pressure Data at Low Wetting-Phase Saturations (includes associated papers 21480 and 21618 ). Society of Petroleum Engineers. doi:10.2118/18331-PA
- ↑ Purcell, W.R. 1949. Capillary Pressures—Their Measurement Using Mercury and the Calculation of Permeability Therefrom. J Pet Technol 1 (2): 39-48. SPE-949039-G.
- ↑ "Fundamentals of Fluid Flow in Porous Media: Chapter 2 Multi-phase Saturated Rock Properties: Laboratory Measurement of Capillary Pressure: Centrifugal Method". http://perminc.com/resources/fundamentals-of-fluid-flow-in-porous-media/.
- ↑ Brooks, R.H. and Corey, A.T. 1964. Hydraulic properties of porous media. Hydrology Paper No. 3, Colorado State University, Fort Collins, Colorado, 22–27.
- ↑ Bentsen, R. G., & Anli, J. (1977, February 1). Using Parameter Estimation Techniques To Convert Centrifuge Data Into a Capillary-Pressure Curve. Society of Petroleum Engineers. doi:10.2118/5026-PA
- ↑ Mirzaei-Paiaman, A.; Ghanbarian, B. (2021). "A new methodology for grouping and averaging capillary pressure curves for reservoir models". Energy Geoscience 2 (1): 52–62. doi:10.1016/j.engeos.2020.09.001.
- ↑ Taber, S. (1930) The mechanics of frost heaving. Journal of Geology, Vol. 38, p. 303-317. In Historical Perspectives in Frost Heave Research, USA Cold Regions Research and Engineering Laboratory, Special Report 91-23, p. 29-35.
- ↑ Beskow, G. (1935) Soil freezing and frost heaving with special applications to roads and railroads. Swedish Geological Society, C, no. 375, Year Book no. 3 (translated by J.O. Osterberg). In Historical Perspectives in Frost Heave Research, USA Cold Regions Research and Engineering Laboratory, Special Report 91-23, p. 41-157.
- ↑ Everett, D.H. (1961). "The thermodynamics offrost damage to porous solids". Transactions of the Faraday Society 57: 1541–1551. doi:10.1039/tf9615701541.
- ↑ Henry, Karen S. (September 2000). A Review of the Thermodynamics of Frost Heave.
- ↑ Klabunde, Richard. "Hydrostatic and Oncotic Pressures". http://www.cvphysiology.com/Microcirculation/M012.
- ↑ Shore, Angela C. (2000). "Capillaroscopy and the measurement of capillary pressure". British Journal of Clinical Pharmacology 50 (6): 501–513. doi:10.1046/j.1365-2125.2000.00278.x. PMID 11136289.
 |
