Physics:Spectral phase interferometry for direct electric-field reconstruction
In ultrafast optics, spectral phase interferometry for direct electric-field reconstruction (SPIDER) is an ultrashort pulse measurement technique originally developed by Chris Iaconis and Ian Walmsley.
The basics
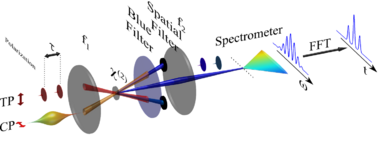
SPIDER is an interferometric ultrashort pulse measurement technique in the frequency domain based on spectral shearing interferometry. Spectral shearing interferometry is similar in concept to lateral shearing interferometry, except the shearing is performed in the frequency domain. The spectral shear is typically generated by sum-frequency mixing the test pulse with two different quasi-monochromatic frequencies (usually derived by chirping a copy of the pulse itself), although it can also be achieved by spectral filtering or even with linear electro-optic modulators for picosecond pulses. The interference between the two upconverted pulses allows the spectral phase at one frequency to be referenced to the spectral phase at a different frequency, separated by the spectral shear - the difference in frequency of the two monochromatic beams. In order to extract the phase information, a carrier fringe pattern is introduced, typically by delaying the two spectrally sheared copies with respect to one another.
Theory
The intensity of the interference pattern from two time-delayed spectrally sheared pulses can be written as
- [math]\displaystyle{ \begin{align}S(\omega) &= |E(\omega) + E(\omega-\Omega)e^{i\omega\tau}|^2\\ &= I(\omega) + I(\omega-\Omega) + 2\sqrt{I(\omega)I(\omega-\Omega)}\cos[\phi(\omega)-\phi(\omega-\Omega)-\omega\tau]\end{align} }[/math],
where [math]\displaystyle{ E(\omega) }[/math] is the analytic signal representing the unknown (upconverted) field being measured, [math]\displaystyle{ \Omega }[/math] is the spectral shear, [math]\displaystyle{ \tau }[/math] is the time delay, [math]\displaystyle{ I(\omega) = |E(\omega)|^2 }[/math] is the spectral intensity and [math]\displaystyle{ \phi(\omega) }[/math] is the spectral phase. For a sufficiently large delay (from 10 to 1000 times the Fourier transform limited [FTL] pulse duration), the interference of the two time-delayed fields results in a cosine modulation with a nominal spacing of [math]\displaystyle{ \delta\omega\sim 2\pi/\tau }[/math]; and any dispersion of the pulse results in minor deviations in the nominal fringe spacing. Effectively it is these deviations in the nominal phase spacing that yield the dispersion of the test pulse .
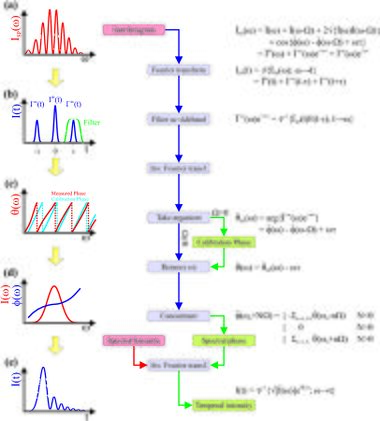
The unknown spectral phase of the pulse can be extracted using a simple, direct algebraic algorithm first described by Takeda.[1] The first step involves Fourier transforming the interferogram into the pseudo time domain:
- [math]\displaystyle{ \begin{align}\widetilde{S}(\widetilde{t}) &= \mathfrak{F}[S(\omega)]\\ &= \widetilde{E}^{dc}(\widetilde{t}) + \widetilde{E}^{ac}(\widetilde{t}-\tau) + \widetilde{E}^{-ac}(\widetilde{t}+\tau)\end{align} }[/math],
where [math]\displaystyle{ \widetilde{E}^{dc}(\widetilde{t}) = \mathfrak{F}[I(\omega) + I(\omega-\Omega)] }[/math] is a 'direct current' (dc) term centred at [math]\displaystyle{ \widetilde{t} }[/math] with a width inversely proportional to the spectral bandwidth, and [math]\displaystyle{ \widetilde{E}^{\pm ac}(\widetilde{t}\mp\tau) = \mathfrak{F}\{ \sqrt{I(\omega)I(\omega-\Omega)}e^{\pm i[\phi(\omega)-\phi(\omega-\Omega)]}e^{\pm i\omega\tau} \} }[/math] are two 'alternating current' (ac) sidebands resulting from the interference of the two fields. The dc term contains information about the spectral intensity only, whereas the ac sidebands contain information about the spectral intensity and phase of the pulse (since the ac sidebands are Hermitian conjugates of each other, they contain the same information).
One of the ac sidebands is filtered out and inverse Fourier transformed back into the frequency domain, where the interferometric spectral phase can be extracted:
- [math]\displaystyle{ \begin{align}D(\omega, \Omega) &= \mathfrak{F}^{-1}[\widetilde{E}^{ac}(\widetilde{t}-\tau)]\\ &= \sqrt{I(\omega)I(\omega-\Omega)}e^{i[\phi(\omega)-\phi(\omega-\Omega)]}e^{-i\omega\tau}\end{align} }[/math].
The final exponential term, resulting from the delay between the two interfering fields, can be obtained and removed from a calibration trace, which is achieved by interfering two unsheared pulses with the same time delay (this is typically performed by measuring the interference pattern of the two fundamental pulses which have the same time-delay as the upconverted pulses). This enables the SPIDER phase to be extracted simply by taking the argument of the calibrated interferometric term:
- [math]\displaystyle{ \begin{align}\theta(\omega) &= \angle[D_\text{cal}(\omega)D^\ast(\omega,\Omega)]\\ &= \phi(\omega-\Omega) - \phi(\omega)\end{align} }[/math].
There are several methods to reconstruct the spectral phase from the SPIDER phase, the simplest, most intuitive and commonly used method is to note that the above equation looks similar to a finite difference of the spectral phase (for small shears) and thus can be integrated using the trapezium rule:
- [math]\displaystyle{ \phi(\omega_N - \Omega/2) \approxeq -\sum_{n=0}^N\frac{\omega_{n+1}-\omega_n}{2\Omega}[\theta(\omega_n)+\theta(\omega_{n+1})] }[/math].
This method is exact for reconstructing group delay dispersion (GDD) and third order dispersion (TOD); the accuracy for higher order dispersion depends on the shear: smaller shear results in higher accuracy.
An alternative method us via concatenation of the SPIDER phase:
- [math]\displaystyle{ \begin{align}\phi(\omega_0 + N|\Omega|) &= \begin{cases} -\sum^N_{n=1} \theta(\omega_0 + n\Omega) &\text{if}\, \Omega\gt 0\\ \sum^{N-1}_{n=0} \theta(\omega_0 + n|\Omega|) &\text{if}\, \Omega\lt 0 \end{cases}\end{align} }[/math]
for integer [math]\displaystyle{ N }[/math] and concatenation grid [math]\displaystyle{ \{\omega_N\} = \{\omega_0 + N|\Omega|\} }[/math]. Note that in the absence of any noise, this would provide an exact reproduction of the spectral phase at the sampled frequencies. However, if [math]\displaystyle{ D(\omega) }[/math] falls to a sufficiently low value at some point on the concatenation grid, then the extracted phase difference at that point is undefined and the relative phase between adjacent spectral points is lost.
The spectral intensity can be found via a quadratic equation using the intensity of the dc and ac terms (filtered independently via a similar method above) or more commonly from an independent measurement (typically the intensity of the dc term from the calibration trace), since this provides the best signal to noise and no distortion from the upconversion process (e.g. spectral filtering from the phase matching function of a 'thick' crystal).
Alternative techniques
Spatially encoded arrangement for SPIDER (SEA-SPIDER) is a variant of SPIDER.[2] [3] [4] [5] The spectral phase of an ultrashort laser pulse is encoded into a spatial fringe pattern rather than a spectral fringe pattern.
Other techniques are frequency-resolved optical gating, streak camera with picosecond response times, and multiphoton intrapulse interference phase scan (MIIPS), a method to characterize and manipulate the ultrashort pulse.
Micro-SPIDER is an implementation of SPIDER in which the spectral shear required for a SPIDER measurement is generated in a thick nonlinear crystal with a carefully engineered phase-matching function.[6] [7]
See also
References
- ↑ Takeda, Mitsuo; Ina, Hideki; Kobayashi, Seiji (1982). "Fourier-transform method of fringe-pattern analysis for computer-based topography and interferometry". Journal of the Optical Society of America 72 (1): 156. doi:10.1364/JOSA.72.000156. ISSN 0030-3941. Bibcode: 1982JOSA...72..156T.
- ↑ Kosik, E.M.; Radunsky, A.; Walmsley, I.A.; Dorrer, C. (2005), "Interferometric technique for measuring broadband ultrashort pulses at the sampling limit", Optics Letters 30 (3): 326–328, doi:10.1364/OL.30.000326, PMID 15751900, Bibcode: 2005OptL...30..326K
- ↑ Wyatt, A.S.; Walmsley, I.A.; Stibenz, G.; Steinmeyer, G. (2006), "Sub-10 fs pulse characterization using spatially encoded arrangement for spectral phase interferometry for direct electric field reconstruction", Optics Letters 31 (12): 1914–1916, doi:10.1364/OL.31.001914, PMID 16729113, Bibcode: 2006OptL...31.1914W, https://ora.ox.ac.uk/objects/uuid:e24f05dd-9745-4782-be86-bade90b3bf93
- ↑ Witting, T.; Austin, D.R.; Walmsley, I.A. (2009), "Improved ancilla preparation in spectral shearing interferometry for accurate ultrafast pulse characterization.", Optics Letters 34 (7): 881–883, doi:10.1364/OL.34.000881, PMID 19340158, Bibcode: 2009OptL...34..881W
- ↑ Wyatt, Adam S.; Grün, Alexander; Bates, Philip K.; Chalus, Olivier; Biegert, Jens; Walmsley, Ian A. (2011). "Accuracy measurements and improvement for complete characterization of optical pulses from nonlinear processes via multiple spectral-shearing interferometry". Optics Express 19 (25): 25355–66. doi:10.1364/OE.19.025355. ISSN 1094-4087. PMID 22273927. Bibcode: 2011OExpr..1925355W. https://ora.ox.ac.uk/objects/uuid:9bcfe7da-5598-4f01-b15a-344aed0cf481.
- ↑ Radunsky, Aleksander S.; Walmsley, Ian A.; Gorza, Simon-Pierre; Wasylczyk, Piotr (2006). "Compact spectral shearing interferometer for ultrashort pulse characterization". Optics Letters 32 (2): 181–3. doi:10.1364/OL.32.000181. ISSN 0146-9592. PMID 17186057.
- ↑ Radunsky, Aleksander S.; Kosik Williams, Ellen M.; Walmsley, Ian A.; Wasylczyk, Piotr; Wasilewski, Wojciech; U'Ren, Alfred B.; Anderson, Matthew E. (2006). "Simplified spectral phase interferometry for direct electric-field reconstruction by using a thick nonlinear crystal". Optics Letters 31 (7): 1008–10. doi:10.1364/OL.31.001008. ISSN 0146-9592. PMID 16599239. Bibcode: 2006OptL...31.1008R.
Further reading
- US patent 6611336, Ian A. Walmsley & Chris Iaconis, "Pulse measurement using frequency shifting techniques", issued 2003-8-26
- Iaconis, C; Walmsley, I. A. (1999), "Self-Referencing Spectral Interferometry for Measuring Ultrashort Optical Pulses", IEEE J. Quantum Electron. 35 (4): 501–509, doi:10.1109/3.753654, Bibcode: 1999IJQE...35..501I
- Iaconis, C; Walmsley, I. A. (1998), "Spectral Phase Interferometry for Direct Electric-Field Reconstruction of Ultrashort Optical Pulses", Opt. Lett. 23 (10): 792–794, doi:10.1364/OL.23.000792, PMID 18087344, Bibcode: 1998OptL...23..792I
- Walmsley, I. A.; Wong, V. (1996), "Characterization of the Electric Field of Ultrashort Optical Pulses", J. Opt. Soc. Am. B 13 (11): 2453–2463, doi:10.1364/JOSAB.13.002453, Bibcode: 1996JOSAB..13.2453W
External links
- new SPIDER page includes links to example code
 |


