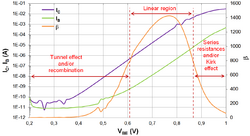
Gummel plot
In electronics, the Gummel plot is the combined plot of the base and collector electric currents, [math]\displaystyle{ I_\text{c} }[/math] and [math]\displaystyle{ I_\text{b} }[/math], of a bipolar transistor vs. the base–emitter voltage, [math]\displaystyle{ V_\text{be} }[/math], on a semi-logarithmic scale. This plot is very useful in device characterization because it reflects on the quality of the emitter–base junction while the base–collector bias, [math]\displaystyle{ V_\text{bc} }[/math], is kept constant.
A number of other device parameters can be garnered either quantitatively or qualitatively directly from the Gummel plot:[1]
- The common-emitter current gain, [math]\displaystyle{ \beta }[/math], and the common-base current gain, [math]\displaystyle{ \alpha }[/math],
- Base and collector ideality factors, [math]\displaystyle{ n }[/math],
- Series resistances and leakage currents.
Sometimes the DC current gain, [math]\displaystyle{ \beta }[/math], is plotted on the same figure as well.
See also
- Hermann Gummel
- Bipolar junction transistor
- Gummel–Poon model
References
- ↑ A. S. Zoolfakar et N. A. Shahrol, «Modelling of NPN Bipolar Junction Transistor Characteristics Using Gummel Plot Technique», in 2010 International Conference on Intelligent Systems, Modelling and Simulation (ISMS), 2010, p. 396–400.
 |


