Software:DataMelt
DataMelt (sometime termed DMelt)[1] is a software program for scientific computation, data analysis and data visualization. The program is used for statistical data analysis, curve fitting, data-mining, machine learning, numeric computations and interactive scientific plotting in 2D and 3D. DataMelt is designed for scientists, engineers and students.
DatMelt logo | |
 Example DataMelt histogram and function | |
| Original author(s) | Dr. Sergei V. Chekanov |
|---|---|
| Initial release | January 15, 2005 under the name JHepWork |
| Stable release | 3.0
/ April 2023 |
| Written in | Java |
| Operating system | Cross-platform. Windows, MacOS, Software:Linux, SaaS |
| Available in | English |
| Type | Computer algebra, information visualization, statistics, Data analysis, Machine learning, Data mining, Data visualization |
| License | Open source (GPLv3 or later, GPL and similar) [2] |
| Website | datamelt |
DataMelt is multiplatform since it is written in Java, thus it runs on any operating system where the Java virtual machine can be installed. DataMelt also uses high-level programming languages, such as Jython, Apache Groovy, JRuby, but Java coding can also be used to call DataMelt numerical and graphical libraries.
DataMelt is an attempt to create a data-analysis environment using open-source packages with a coherent user interface and tools competitive to commercial programs. The idea behind the project is to incorporate open-source mathematical and numerical software packages with GUI-type user interfaces into a coherent program in which the main user interface is based on short-named Java/Python classes. This was required to build an analysis environment using Java scripting concept. A typical example will be shown below.
Scripts and Java code (in case of the Java programming) can be run either in a GUI editor of DataMelt or as batch programs. The graphical libraries of DataMelt can be used to create applets. All charts (or "Canvases") used for data representation can be embedded into Web browsers.
DataMelt can be used for analysis of large numerical data volumes, data mining, statistical data analysis and mathematics are essential. The program can be used in natural sciences, engineering, modeling and analysis of financial markets. While the program falls into the category of open source software, it is not completely free for commercial usage (see below), no source code is available on the home page, and all documentation and even bug reporting requires "membership".
Overview
DataMelt has several features for data analysis:
- uses Jython, BeanShell, Groovy, JRuby scripting, or the standard Java. The Software:GNU Octave mode is also available for symbolic calculations;
- can be integrated with the Web in forms of applets or Java Web-start applications, thus it is suited for distributed analysis environment via the Internet;
- has a full-featured IDE with syntax highlighting, syntax checker, code completion and analyser. It includes a version of IDE for small-screen devices;
- includes a help system with a code completion based on the Java reflection technology;
- uses a platform-neutral I/O based on Google's Protocol Buffers. Data can be written in C++ and analyzed using Java/Jython. It has a browser for serialized objects and objects created using Google Protocol Buffers;
- includes SQL-based and NoSQL databases
- includes packages for statistical calculations, error (uncertainty) propagation using a linear expansion or a Monte Carlo approach for arbitrary function, symbolic calculations similar to those found in the GNU Octave project or MATLAB, but rewritten in Java;
- includes a number of Neural networks, such as Software:JOONE and Encog, which can be accesses via the GUI or using Java scripting
Data-analysis features
The package supports several mathematical, data-analysis and data mining features:
- 2D and 3D interactive visualization of data, functions, histograms, charts.
- analytic calculations using MATLAB or GNU Octave syntax
- histograms in 2D and 3D, as well as profile histograms
- random numbers and statistical samples
- functions, including parametric equations in 3D
- contour plots, scatter plots
- neural networks
- linear regression and curve fitting using several minimization techniques
- Cluster analysis (K-means clustering analysis (single and multi pass), Fuzzy (C-means) algorithm, agglomerative hierarchical clustering)
- Input and Output (IO) for all data objects (arrays, functions, histograms) are based on Java serialization. There is also a support for I/O from/to C++ and other languages using the Google's Protocol Buffers format. Several databases are supported (Java-object databases and SQL-based)
- Cellular automaton
- output to high-quality Vector graphics. Support for PostScript, EPS, PDF and raster formats
- Software:VisAD data visualization integrated with scripting languages.
Symbolic and numeric calculations
Symbolic calculations use GNU Octave scripting language. The following methods are available:
- Systems of polynomial equations solving
- vectors and matrix algebra
- Factorization
- derivatives
- integrals (rational functions)
- Boolean algebra
- Simplification
- Geometric algebra
Input and output
DataMelt includes the native Java and Python methods for file input and outputs. In addition, it allows to write data in the following formats:
- The HFile format based on Java serialization. Optionally, compression and XML serialization are supported. Data can be written sequentially or using the key-value maps.
- The PFile format based on the Protocol Buffers engine for multiplatform input output
- The HBook format, which is a simplified XML format to write large data structures without XML tags
- Arbitrary data structure can be written into object databases with file system as back-end. This allows writing large data collections to files which normally do not fit into the computer memory.
- Several SQL database engines are included as external packages
- AIDA file format (read only)
- ROOT file format (read only)
Data stored in external files can be viewed using browsers for convenient visualization.
History
DataMelt has its roots in particle physics where data mining is a primary task. It was created as Software:jHepWork project in 2005 and it was initially written for data analysis for particle physics[3] using the Java software concept for International Linear Collider project developed at SLAC. Later versions of jHepWork were modified for general public use (for scientists, engineers, students for educational purpose) since the International Linear Collider project has stalled. In 2013, jHepWork was renamed to DataMelt and become a general-purpose community-supported project. The main source of the reference is the book "Scientific Data analysis using Jython Scripting and Java" [4] which discusses data-analysis methods using Java and Jython scripting. Later it was also discussed in the German Java SPEKTRUM journal [5]. The string "HEP" in the project name "jHepWork" abbreviates "High-Energy Physics". But due to a wide popularity outside this area of physics, it was renamed to ScaVis (Scientific Computation and Visualization Environment). This project existed for 3 years before it was renamed to DataMelt (or, in short, DMelt).
DataMelt is hosted by the jWork.ORG portal[6]
Supported platforms
DataMelt runs on Windows, Software:macOS, Software:Linux and the Android platforms. The package for the Android is called AWork.
Documentation
DataMelt is extensively documented. In 2018, the web page of this project contained about 600 examples written in Jython, Java, Groovy, JRuby, covering a number of fields, from general mathematics to data mining and data visualization. The Java API documentation includes the description of more than 40,000 Java classes. In addition, there is a wiki documentation. The documentation includes certain restrictions for general public due to the proprietorial nature of the documentation project.
License terms
DataMelt is licensed by Freemium license. The core source code of the numerical and graphical libraries is licensed by the GNU General Public License. The interactive development environment (IDE) used by DataMelt has some restrictions for commercial usage since language files, documentation files, examples, installer, code-assist databases, interactive help are licensed by the creative-common license. Full members of the DataMelt project have several benefits, such as: the license for a commercial usage, access to the source repository, an extended help system, a user script repository and an access to the complete documentation.
The commercial licenses cannot apply to source code that was imported or contributed[7] to DataMelt from other authors.
Examples
Jython scripts
Here is an example of how to show 2D bar graphs by reading a CVS file downloaded from the World Bank web site.
from jhplot.io.csv import *
from java.io import *
from jhplot import *

d = {}
reader = CSVReader(FileReader("ny.gdp.pcap.cd_Indicator_en_csv_v2.csv"));
while True:
    nextLine = reader.readNext()
    if nextLine is None:
        break
    xlen = len(nextLine)
    if xlen < 50:
        continue
    d[nextLine[0]] = float(nextLine[xlen-2]) # key=country, value=DGP

c1 = HChart("2013",800,400)
#c1.setGTitle("2013 Gross domestic product  per capita")
c1.visible()
c1.setChartBar()
c1.setNameY("current US $")
c1.setNameX("")
c1.setName("2013 Gross domestic product  per capita")

name1 = "Data Source: World Development Indicators"

set_value = lambda name: c1.valueBar(d[name], name, name1)

set_value(name="Russia")
set_value(name="Poland")
set_value(name="Romania")
set_value(name="Bulgaria")
set_value(name="Belarus")
set_value(name="Ukraine")
c1.update()
The execution of this script plots a bar chart in a separate window. The image can be saved in a number of formats.
Here is another simple example which illustrates how to fill a 2D histogram and display it on a canvas. The script also creates a figure in the PDF format. This script illustrates how to glue and mix the native JAVA classes (from the package java.util) and DataMelt classes (the package jhplot) inside a script written using the Python syntax.
from java.util import Random
from jhplot import *

c1 = HPlot3D("Canvas") # create an interactive canvas
c1.setGTitle("Global title")
c1.setNameX("X")
c1.setNameY("Y")
c1.visible()
c1.setAutoRange()

h1 = H2D("2D histogram", 25, -3.0, 3.0, 25, -3.0, 3.0)
rand = Random()
for i in range(200):
    h1.fill(rand.nextGaussian(), rand.nextGaussian())
c1.draw(h1)
c1.export("jhplot3d.eps") # export to EPS Vector Graphics
This script can be run either using DataMelt IDE or using a stand-alone Jython after specifying classpath to DataMelt libraries. The output is shown below:

Groovy scripts
The same example can also be coded using the Groovy programming language which is supported by DataMelt.
import java.util.Random
import jhplot.*

c1 = new HPlot3D("Canvas")  //  create an interactive canvas
c1.setGTitle("Global title")
c1.setNameX("X")
c1.setNameY("Y")
c1.visible()
c1.setAutoRange()

h1 = new H2D("2D histogram",25,-3.0, 3.0,25,-3.0, 3.0)
rand = Random()
(1..200).each{ // or (0..<200).each{
// or Java: for (i=0; i<200; i++){
// if argument is required, you cann access it through "it" inside the loop:
// (0..<200).each{ println "step: ${it+1}" }
     h1.fill(rand.nextGaussian(),rand.nextGaussian())
}
c1.draw(h1);
c1.export("jhplot3d.eps") // export to EPS Vector Graphics
Groovy is better integrated with Java and can be a factor three faster for long loops over primitives compared to Jython.
DMelt search engine
The DMelt project includes one of the fastest full-text [8] search engines that allows searches in the Java API and 50,000 Java classes related to data science, as well as in about 800 examples implemented in Java, Python and Groovy. Searches can be performed either in titles or the full content of Java API. The total number of documents used in the full-search is more than 60k.
Reviews and comparisons
DataMelt and its earlier versions, SCaVis (2013-2015) and JHepWork (2005-2013), which are still available from DataMelt archive repository, are described in these articles: [9] [5] [10] [11]. The program was compared with other similar frameworks in these resources [12] [13] [14] [15]
The DataMelt (2015-), a new development [16] [17] of the JHepWork and SCaVis programs. Comparisons of DataMelt with other popular packages for statistical and numeric analysis are given in these resources [18] [19] [20] [21] [22]. Comparison of DataMelt with other data-mining packages are given in this article [23]. According to more recent surveys of online articles and blogs on data science, DataMelt is among popular data-analysis and mathematical software programs [24].
Usage
jHepWork, SCaVis/DatMelt are part of the software library of National Institutes of Health Library [25], Mathematical support of Institute for Nuclear Research of Russian academy of Sciences[26] and others. On a commercial site, DataMelt is provided as a service on Amazon EC2 clouds by the Miri Infotech IT Solution Provider company [27]. DataMelt libraries are included in Jas4pp program used for physics analysis.
It is difficult to judge how many users use DataMelt since download information from the main resource [24] is not available. Sourceforge, which provides an alternative download option, quotes 300 monthly downloads [25] (May 2018).
One estimate can be done by looking at the popularity of the book [28] which is an introduction to the DataMelt program. According to the Springer International, this book is top 25% most downloadable books in 2016 and 2017 in the category "Advanced Information and Knowledge Processing" Since the publication of the book, Springer detects 34k chapter downloads until May 2019[29], about 1500 per chapter. The previous book describing jHepWork had a similar popularity [30]. Bookmetrix estimates 3000 readers of the DataMelt book.
References
- ↑ Numeric Computation and Statistical Data Analysis on the Java Platform (Book). S.V.Chekanov, Springer, (2016) ISBN 978-3-319-28531-3, 700 pages, [1]
- ↑ "DataMelt - License". https://jwork.org/dmelt/about/.
- ↑ HEP data analysis using jHepWork and Java, arXiv:0809.0840v2, ANL-HEP-CP-08-53 preprint. CERN preprint, arXiv:0809.0840v2
- ↑ Scientific Data analysis using Jython Scripting and Java. Book. By S.V.Chekanov, Springer-Verlag, ISBN 978-1-84996-286-5, [2]
- ↑ 5.0 5.1
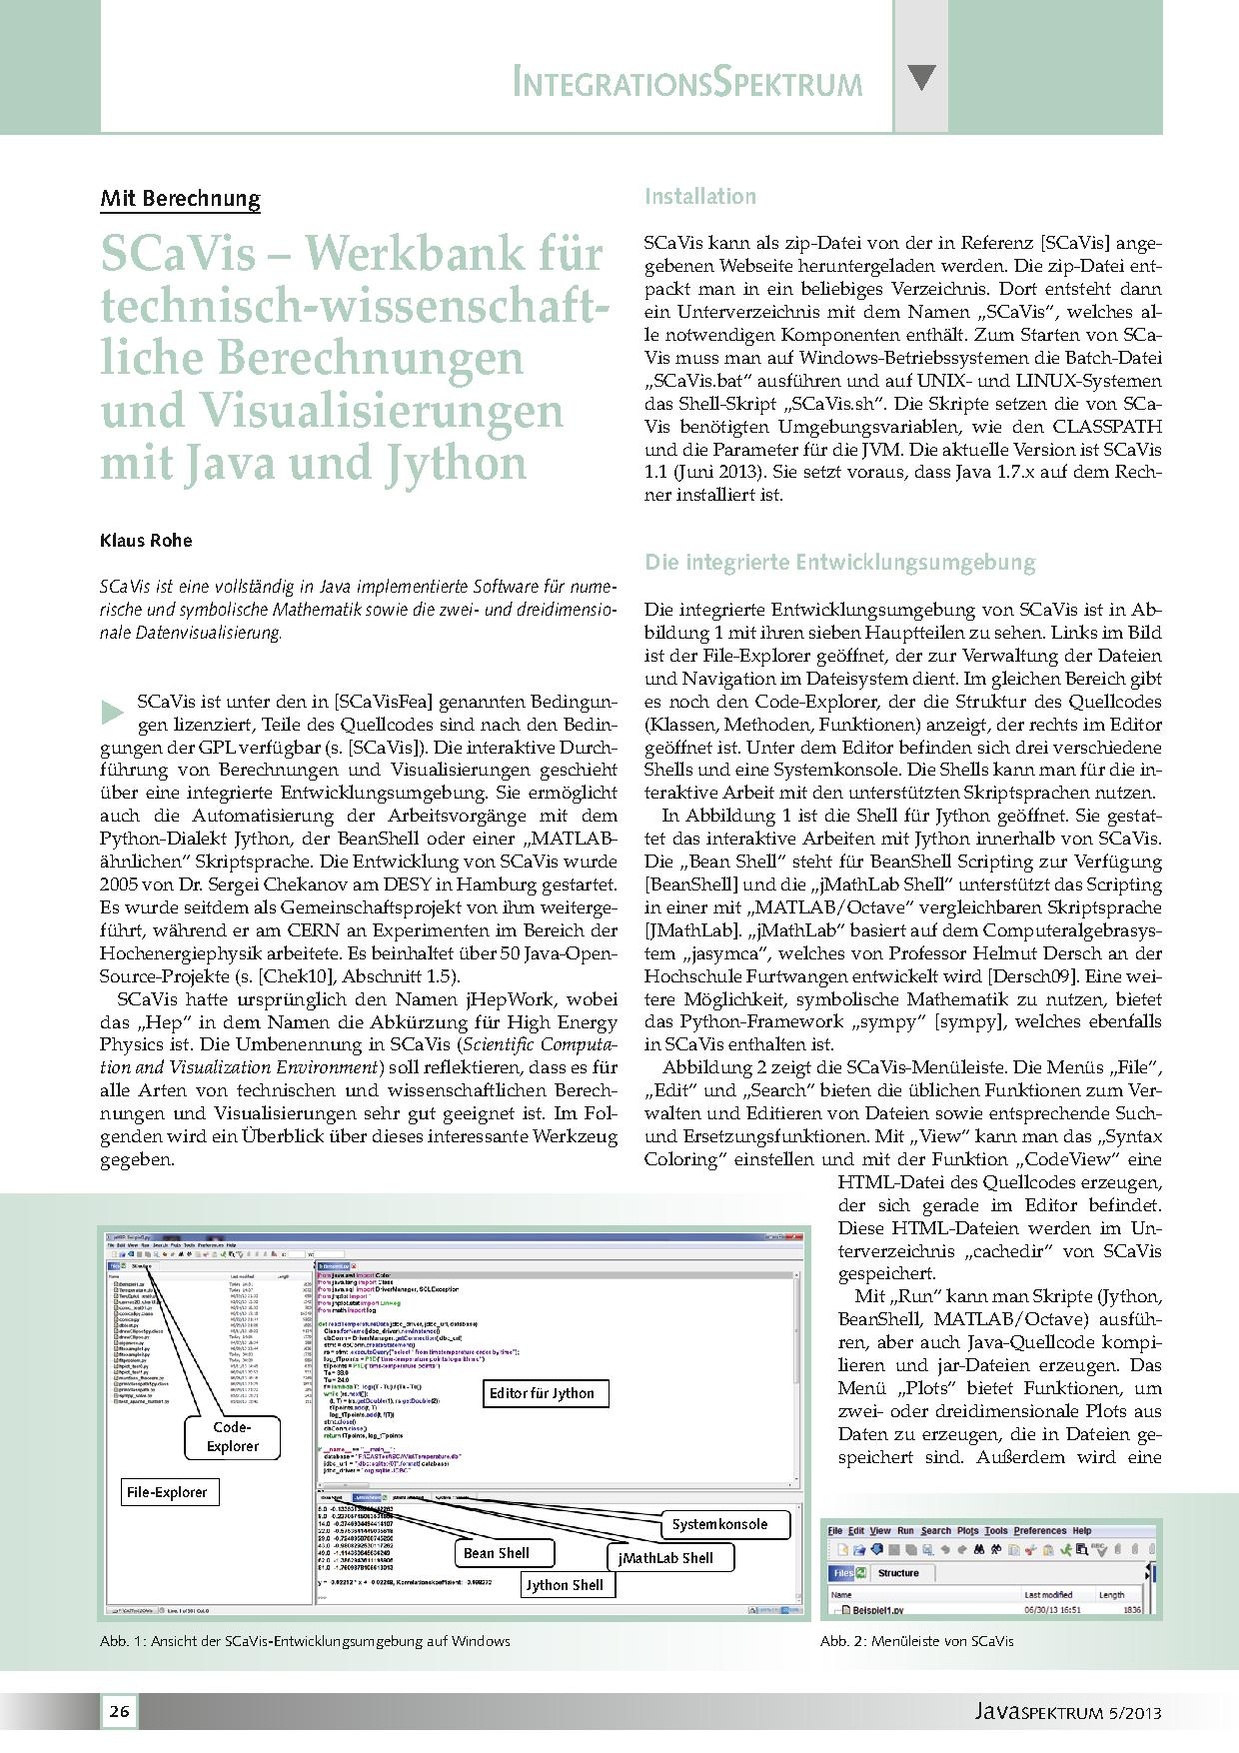
SCaVis (previous name of DataMelt)– Werkbank für technisch-wissenschaftliche Berechnungen und Visualisierungen mit Java und Jython. by Rohe Klaus. Java SPEKTRUM. (in German) volume 5 (2013) 26-28 [3]
- ↑ jWork.ORG Community Portal focused on Java scientific software. [4]
- ↑ "Contributed Packages (DataMelt Manual)". http://jwork.org/wiki/DMelt:Dev/Contributions.
- ↑ Search in DataMelt. https://datamelt.org/search/ (retrieved March 2021)
- ↑ Data Analysis and Data Mining Using Java, Jython and jHepWork (2010). Oracle.com. Article (archived) by A,Astorza et al. [5]
- ↑ HEP data analysis using jHepWork and Java. Proceedings of the HERA-LHC workshops (2007-2008), DESY-CERN [6]
- ↑ Suitability analysis of data mining tools and methods. [7]. S.Kovac, Bachelor's thesis (in English), jHepWork is reviewed on page 39-42, Masaryk University.
- ↑ A Review: Comparative Study of Diverse Collection of Data Mining Tools. By S. Sarumathi, N. Shanthi, S. Vidhya, M. Sharmila. International Journal of Computer, Control, Quantum and Information Engineering. 2014; 8(6). 7.
- ↑ A Study of Tools, Techniques, and Trends for Big Data Analytics. By R.Shireesha et al. (2016) International Journal of Advance Computing Technique and Applications (IJACTA), ISSN : 2321-4546, Vol 4, Issue 1 [8]
- ↑ Comparison of Various Tools for Data Mining. By P.Kaur etc. IJERT ISSN: 2278-0181 Vol. 3 Issue 10 (2010) [[9]]
- ↑ Advanced Web and Network Technologies, and Applications. By Heng Tao Shen et al. Springer Science & Business Media - 2006-01-09
- ↑ Numeric Computation and Statistical Data Analysis on the Java Platform (Book). S.V.Chekanov, Springer, (2016) ISBN 978-3-319-28531-3, 700 pages, [10]
- ↑ DataMelt: Free Computation and Visualization Environment. By Moaaz Aldesoky. Medevel.Com [11]
- ↑ Comparative Analysis of Information Extraction Techniques for Data Mining, by Amit Verma et al. Indian Journal of Science and Technology, Vol 9, March 2016 [12]
- ↑ Evaluation and comparison of open source software suites for data mining and knowledge discovery. A.H. Altalhi et al. Wiley Online Library (2017) [13]
- ↑ Brief Review of Educational Applications Using Data Mining and Machine Learning, [14], by A. Berenice Urbina Nájera, Jorgede la Calleja Mora, Redie ISSN 1607-4041. Revista Electrónica de Investigación Educativa, 19(4), 84-96
- ↑ Analysis of Data Using Data Mining tool Orange. Maqsud S.Kukasvadiya et. al. [15] (2017) IJEDR, Volume 5, Issue 2, ISSN: 2321-9939
- ↑ Big Data - A Survey of Big Data Technologies. By P.Dhavalchandra, M.Jignasu, R.Amit. International Journal of Science and Technology. Volume 2, p45-50 (2016) [16]
- ↑ Evaluation and comparison of open source software suites for data mining and knowledge discovery, by Abdulrahman H. Altalhi, J. M. Luna, M. A. Vallejo, S. Ventura, Wires/Willey, DOI: 10.1002/widm.1204 (2017), [17]
- ↑ Popularity of software programs for data science using recent reviews, Article (Sep 2018), T.Smalzer (retrieved in 2019), [18]
- ↑ Data Sciences Workstation: SCaVis. By Lisa Federer. National Institutes of Health Library [19]
- ↑ The DataForge, Sector for Mathematical Support of Institute for Nuclear Research of Russian academy of Sciences [20]
- ↑ Miri Infotech. A Complete IT Solution Provider. DataMelt deployment
- ↑ Numeric Computation and Statistical Data Analysis on the Java Platform (Book). S.V.Chekanov, Springer, (2016) ISBN 978-3-319-28531-3, 700 pages, [21]
- ↑ Springer download Statistics of the book "Numeric Computation and Statistical Data Analysis on the Java Platform" 2016 [22]
- ↑ Springer download Statistics of the book "Scientific Data Analysis using Jython Scripting and Java" [23]
 |

