Condorcet paradox
The Condorcet paradox (also known as the voting paradox or the paradox of voting) in social choice theory is a situation noted by the Marquis de Condorcet in the late 18th century,[1][2][3] in which collective preferences can be cyclic, even if the preferences of individual voters are not cyclic. This is paradoxical, because it means that majority wishes can be in conflict with each other: Suppose majorities prefer, for example, candidate A over B, B over C, and yet C over A. When this occurs, it is because the conflicting majorities are each made up of different groups of individuals.
Thus an expectation that transitivity on the part of all individuals' preferences should result in transitivity of societal preferences is an example of a fallacy of composition.
The paradox was independently discovered by Lewis Carroll and Edward J. Nanson, but its significance was not recognized until popularized by Duncan Black in the 1940s.[4]
Example

Suppose we have three candidates, A, B, and C, and that there are three voters with preferences as follows (candidates being listed left-to-right for each voter in decreasing order of preference):
| Voter | First preference | Second preference | Third preference |
|---|---|---|---|
| Voter 1 | A | B | C |
| Voter 2 | B | C | A |
| Voter 3 | C | A | B |
If C is chosen as the winner, it can be argued that B should win instead, since two voters (1 and 2) prefer B to C and only one voter (3) prefers C to B. However, by the same argument A is preferred to B, and C is preferred to A, by a margin of two to one on each occasion. Thus the society's preferences show cycling: A is preferred over B which is preferred over C which is preferred over A.
Cardinal ratings

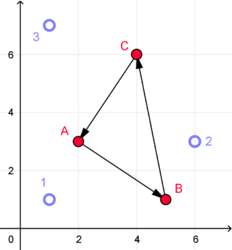
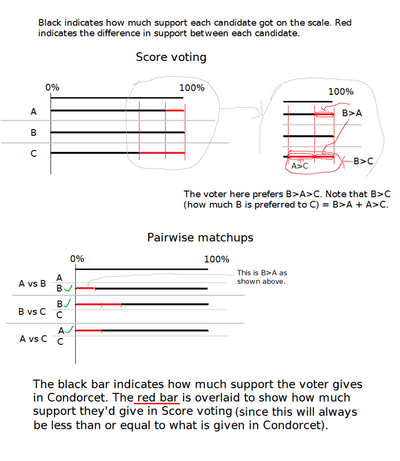
Note that in the graphical example, the voters and candidates are not symmetrical, but the ranked voting system "flattens" their preferences into a symmetrical cycle.[5] Cardinal voting systems provide more information than rankings, allowing a winner to be found.[6][7] For instance, under score voting, the ballots might be:[8]
| A | B | C | |
|---|---|---|---|
| 1 | 6 | 3 | 0 |
| 2 | 0 | 6 | 1 |
| 3 | 5 | 0 | 6 |
| Total: | 11 | 9 | 7 |
Candidate A gets the largest score, and is the winner, as A is the nearest to all voters. However, a majority of voters have an incentive to give A a 0 and C a 10, allowing C to beat A, which they prefer, at which point, a majority will then have an incentive to give C a 0 and B a 10, to make B win, etc. (In this particular example, though, the incentive is weak, as those who prefer C to A only score C 1 point above A; in a ranked Condorcet method, it's quite possible they would simply equally rank A and C because of how weak their preference is, in which case a Condorcet cycle wouldn't have formed in the first place, and A would've been the Condorcet winner). So though the cycle doesn't occur in any given set of votes, it can appear through iterated elections with strategic voters with cardinal ratings.
Necessary condition for the paradox
Suppose that x is the fraction of voters who prefer A over B and that y is the fraction of voters who prefer B over C. It has been shown[9] that the fraction z of voters who prefer A over C is always at least (x + y – 1). Since the paradox (a majority preferring C over A) requires z < 1/2, a necessary condition for the paradox is that
Likelihood of the paradox
It is possible to estimate the probability of the paradox by extrapolating from real election data, or using mathematical models of voter behavior, though the results depend strongly on which model is used. In particular, Andranik Tangian has proved that the probability of Condorcet paradox is negligible in a large society.[10][11]
Impartial culture model
We can calculate the probability of seeing the paradox for the special case where voter preferences are uniformly distributed among the candidates. (This is the "impartial culture" model, which is known to be unrealistic,[12][13][14]: 40 so, in practice, a Condorcet paradox may be more or less likely than this calculation.[15]: 320 [16])
For voters providing a preference list of three candidates A, B, C, we write (resp. , ) the random variable equal to the number of voters who placed A in front of B (respectively B in front of C, C in front of A). The sought probability is (we double because there is also the symmetric case A> C> B> A). We show that, for odd , where which makes one need to know only the joint distribution of and .
If we put , we show the relation which makes it possible to compute this distribution by recurrence: .
The following results are then obtained:
| 3 | 101 | 201 | 301 | 401 | 501 | 601 | |
|---|---|---|---|---|---|---|---|
| 5.556% | 8.690% | 8.732% | 8.746% | 8.753% | 8.757% | 8.760% |
The sequence seems to be tending towards a finite limit.
Using the central limit theorem, we show that tends to where is a variable following a Cauchy distribution, which gives (constant quoted in the OEIS).
The asymptotic probability of encountering the Condorcet paradox is therefore which gives the value 8.77%.[17][18]
Some results for the case of more than three candidates have been calculated[19] and simulated.[20] The simulated likelihood for an impartial culture model with 25 voters increases with the number of candidates:[20]: 28
| 3 | 4 | 5 | 7 | 10 |
|---|---|---|---|---|
| 8.4% | 16.6% | 24.2% | 35.7% | 47.5% |
The likelihood of a Condorcet cycle for related models approach these values for large electorates:[18]
- Impartial anonymous culture (IAC): 6.25%
- Uniform culture (UC): 6.25%
- Maximal culture condition (MC): 9.17%
All of these models are unrealistic, and are investigated to establish an upper bound on the likelihood of a cycle.[18]
Group coherence models
When modeled with more realistic voter preferences, Condorcet paradoxes in elections with a small number of candidates and a large number of voters become very rare.[14]: 78
Spatial model
A study of three-candidate elections analyzed 12 different models of voter behavior, and found the spatial model of voting to be the most accurate to real-world ranked-ballot election data. Analyzing this spatial model, they found the likelihood of a cycle to decrease to zero as the number of voters increases, with likelihoods of 5% for 100 voters, 0.5% for 1000 voters, and 0.06% for 10,000 voters.[21]
Another spatial model found likelihoods of 2% or less in all simulations of 201 voters and 5 candidates, whether two or four-dimensional, with or without correlation between dimensions, and with two different dispersions of candidates.[20]: 31
Empirical studies
Many attempts have been made at finding empirical examples of the paradox.[22] Empirical identification of a Condorcet paradox presupposes extensive data on the decision-makers' preferences over all alternatives—something that is only very rarely available.
A summary of 37 individual studies, covering a total of 265 real-world elections, large and small, found 25 instances of a Condorcet paradox, for a total likelihood of 9.4%[15]: 325 (and this may be a high estimate, since cases of the paradox are more likely to be reported on than cases without).[14]: 47
An analysis of 883 three-candidate elections extracted from 84 real-world ranked-ballot elections of the Electoral Reform Society found a Condorcet cycle likelihood of 0.7%. These derived elections had between 350 and 1,957 voters. A similar analysis of data from the 1970–2004 American National Election Studies thermometer scale surveys found a Condorcet cycle likelihood of 0.4%. These derived elections had between 759 and 2,521 "voters".[21]
While examples of the paradox seem to occur occasionally in small settings (e.g., parliaments) very few examples have been found in larger groups (e.g. electorates), although some have been identified.[23]
Implications
When a Condorcet method is used to determine an election, the voting paradox of cyclical societal preferences implies that the election has no Condorcet winner: no candidate who can win a one-on-one election against each other candidate. There will still be a smallest group of candidates, known as the Smith set, such that each candidate in the group can win a one-on-one election against each of the candidates outside the group. The several variants of the Condorcet method differ on how they resolve such ambiguities when they arise to determine a winner.[24] The Condorcet methods which always elect someone from the Smith set when there is no Condorcet winner are known as Smith-efficient. Note that using only rankings, there is no fair and deterministic resolution to the trivial example given earlier because each candidate is in an exactly symmetrical situation.
Situations having the voting paradox can cause voting mechanisms to violate the axiom of independence of irrelevant alternatives—the choice of winner by a voting mechanism could be influenced by whether or not a losing candidate is available to be voted for.
Two-stage voting processes
One important implication of the possible existence of the voting paradox in a practical situation is that in a two-stage voting process, the eventual winner may depend on the way the two stages are structured. For example, suppose the winner of A versus B in the open primary contest for one party's leadership will then face the second party's leader, C, in the general election. In the earlier example, A would defeat B for the first party's nomination, and then would lose to C in the general election. But if B were in the second party instead of the first, B would defeat C for that party's nomination, and then would lose to A in the general election. Thus the structure of the two stages makes a difference for whether A or C is the ultimate winner.
Likewise, the structure of a sequence of votes in a legislature can be manipulated by the person arranging the votes, to ensure a preferred outcome.
See also
- Arrow's impossibility theorem
- Kenneth Arrow, Section with an example of a distributional difficulty of intransitivity + majority rule
- Discursive dilemma
- Gibbard–Satterthwaite theorem
- Independence of irrelevant alternatives
- Instant-runoff voting
- Nakamura number
- Quadratic voting
- Rock paper scissors
- Simpson's paradox
- Smith set
References
- ↑ Marquis de Condorcet (1785) (in fr) (PNG). Essai sur l'application de l'analyse à la probabilité des décisions rendues à la pluralité des voix. http://gallica.bnf.fr/ark:/12148/bpt6k417181. Retrieved 2008-03-10.
- ↑ Condorcet, Jean-Antoine-Nicolas de Caritat; Sommerlad, Fiona; McLean, Iain (1989-01-01). The political theory of Condorcet. Oxford: University of Oxford, Faculty of Social Studies. pp. 69–80, 152–166. OCLC 20408445. "Clearly, if anyone's vote was self-contradictory (having cyclic preferences), it would have to be discounted, and we should therefore establish a form of voting which makes such absurdities impossible"
- ↑ Gehrlein, William V. (2002). "Condorcet's paradox and the likelihood of its occurrence: different perspectives on balanced preferences*". Theory and Decision 52 (2): 171–199. doi:10.1023/A:1015551010381. ISSN 0040-5833. "Here, Condorcet notes that we have a 'contradictory system' that represents what has come to be known as Condorcet's Paradox.".
- ↑ Riker, William Harrison. (1982). Liberalism against populism : a confrontation between the theory of democracy and the theory of social choice. Waveland Pr. pp. 2. ISBN 0881333670. OCLC 316034736.
- ↑ Procaccia, Ariel D.; Rosenschein, Jeffrey S. (2006-09-11). Klusch, Matthias. ed. The Distortion of Cardinal Preferences in Voting. Lecture Notes in Computer Science. Springer Berlin Heidelberg. pp. 317–331. doi:10.1007/11839354_23. ISBN 9783540385691. http://procaccia.info/papers/distortion.cia06.pdf. "agents' cardinal (utility-based) preferences are embedded into the space of ordinal preferences. This often gives rise to a distortion in the preferences, and hence in the social welfare of the outcome"
- ↑ Poundstone, William (2008). Gaming the vote: Why elections aren't fair (and what we can do about it). Hill & Wang. pp. 158. ISBN 978-0809048922. OCLC 276908223. https://books.google.com/books?id=_24bJHyBV6sC&pg=PA159. "This is the fundamental problem with two-way comparisons. There is no accounting for degrees of preference. ... Cycles result from giving equal weight to unequal preferences. ... The paradox obscures the fact that the voters really do prefer one option."
- ↑ Kok, Jan; Shentrup, Clay; Smith, Warren. "Condorcet cycles". http://rangevoting.org/CondorcetCycles.html#PoundstoneCycPic. "...any method based just on rank-order votes, fails miserably. Range voting, which allows voters to express strength of preferences, would presumably succeed in choosing the best capital A."
- ↑ In this example, the available scores are 0–6, and each voter normalizes their max/min scores to this range, while selecting a score for the middle that is proportional to distance.
- ↑ Silver, Charles. "The voting paradox", The Mathematical Gazette 76, November 1992, 387–388.
- ↑ Tangian, Andranik (2000). "Unlikelihood of Condorcet's paradox in a large society". Social Choice and Welfare 17 (2): 337–365. doi:10.1007/s003550050024.
- ↑ Tangian, Andranik (2020). Analytical theory of democracy. Vols. 1 and 2. Studies in Choice and Welfare. Cham, Switzerland: Springer. pp. 158–162. doi:10.1007/978-3-030-39691-6. ISBN 978-3-030-39690-9.
- ↑ Tsetlin, Ilia; Regenwetter, Michel; Grofman, Bernard (2003-12-01). "The impartial culture maximizes the probability of majority cycles". Social Choice and Welfare 21 (3): 387–398. doi:10.1007/s00355-003-0269-z. ISSN 0176-1714. "it is widely acknowledged that the impartial culture is unrealistic ... the impartial culture is the worst case scenario".
- ↑ Tideman, T; Plassmann, Florenz (June 2008). The Source of Election Results: An Empirical Analysis of Statistical Models of Voter Behavior. https://www.researchgate.net/publication/228920943. "Voting theorists generally acknowledge that they consider this model to be unrealistic".
- ↑ 14.0 14.1 14.2 Gehrlein, William V.; Lepelley, Dominique (2011). Voting paradoxes and group coherence : the condorcet efficiency of voting rules. Berlin: Springer. doi:10.1007/978-3-642-03107-6. ISBN 9783642031076. OCLC 695387286. "most election results do not correspond to anything like any of DC, IC, IAC or MC ... empirical studies ... indicate that some of the most common paradoxes are relatively unlikely to be observed in actual elections. ... it is easily concluded that Condorcet’s Paradox should very rarely be observed in any real elections on a small number of candidates with large electorates, as long as voters’ preferences reflect any reasonable degree of group mutual coherence"
- ↑ 15.0 15.1 Van Deemen, Adrian (2014). "On the empirical relevance of Condorcet's paradox" (in en). Public Choice 158 (3–4): 311–330. doi:10.1007/s11127-013-0133-3. ISSN 0048-5829. "small departures of the impartial culture assumption may lead to large changes in the probability of the paradox. It may lead to huge declines or, just the opposite, to huge increases.".
- ↑ May, Robert M. (1971). "Some mathematical remarks on the paradox of voting". Behavioral Science 16 (2): 143–151. doi:10.1002/bs.3830160204. ISSN 0005-7940.
- ↑ Guilbaud, Georges-Théodule (2012). "Les théories de l'intérêt général et le problème logique de l'agrégation". Revue économique 63 (4): 659. doi:10.3917/reco.634.0659. ISSN 0035-2764.
- ↑ 18.0 18.1 18.2 Gehrlein, William V. (2002-03-01). "Condorcet's paradox and the likelihood of its occurrence: different perspectives on balanced preferences*" (in en). Theory and Decision 52 (2): 171–199. doi:10.1023/A:1015551010381. ISSN 1573-7187. https://doi.org/10.1023/A:1015551010381. "to have a PMRW with probability approaching 15/16 = 0.9375 with IAC and UC, and approaching 109/120 = 0.9083 for MC. … these cases represent situations in which the probability that a PMRW exists would tend to be at a minimum … intended to give us some idea of the lower bound on the likelihood that a PMRW exists.".
- ↑ Gehrlein, William V. (1997). "Condorcet's paradox and the Condorcet efficiency of voting rules". Mathematica Japonica 45: 173–199. https://www.researchgate.net/publication/257651659.
- ↑ 20.0 20.1 20.2 Merrill, Samuel (1984). "A Comparison of Efficiency of Multicandidate Electoral Systems". American Journal of Political Science 28 (1): 23–48. doi:10.2307/2110786. ISSN 0092-5853. https://www.jstor.org/stable/2110786.
- ↑ 21.0 21.1 Tideman, T. Nicolaus; Plassmann, Florenz (2012), Felsenthal, Dan S.; Machover, Moshé, eds., "Modeling the Outcomes of Vote-Casting in Actual Elections", Electoral Systems (Berlin, Heidelberg: Springer Berlin Heidelberg): Table 9.6 Shares of strict pairwise majority rule winners (SPMRWs) in observed and simulated elections, doi:10.1007/978-3-642-20441-8_9, ISBN 978-3-642-20440-1, http://link.springer.com/10.1007/978-3-642-20441-8_9, retrieved 2021-11-12, "Mean number of voters: 1000 … Spatial model: 99.47% [0.5% cycle likelihood] … 716.4 [ERS data] … Observed elections: 99.32% … 1,566.7 [ANES data] … 99.56%"
- ↑ Kurrild-Klitgaard, Peter (2014). "Empirical social choice: An introduction" (in en). Public Choice 158 (3–4): 297–310. doi:10.1007/s11127-014-0164-4. ISSN 0048-5829.
- ↑ Kurrild-Klitgaard, Peter (2014). "An empirical example of the Condorcet paradox of voting in a large electorate" (in en). Public Choice 107: 135–145. doi:10.1023/A:1010304729545. ISSN 0048-5829.
- ↑ Lippman, David (2014). "Voting Theory". Math in society. ISBN 978-1479276530. OCLC 913874268. http://www.opentextbookstore.com/mathinsociety/. "There are many Condorcet Methods, which vary primarily in how they deal with ties, which are very common when a Condorcet winner does not exist."
Further reading
- Garman, M. B.; Kamien, M. I. (1968). "The paradox of voting: Probability calculations". Behavioral Science 13 (4): 306–316. doi:10.1002/bs.3830130405. PMID 5663897.
- Niemi, R. G.; Weisberg, H. (1968). "A mathematical solution for the probability of the paradox of voting". Behavioral Science 13 (4): 317–323. doi:10.1002/bs.3830130406. PMID 5663898.
- Niemi, R. G.; Wright, J. R. (1987). "Voting cycles and the structure of individual preferences". Social Choice and Welfare 4 (3): 173–183. doi:10.1007/BF00433943.
 |


