Earth:Antarctic ice sheet
| Antarctic Ice Sheet | |
|---|---|
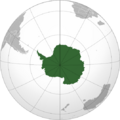
 Geographic map of Antarctica, with the grounded ice sheet in white, its floating ice shelves in gray, and ice-free land in brown. | |
| Type | Ice sheet |
| Location | Antarctica |
| Area | 14×106 km2 (5.4×10⁶ sq mi)[1] |
| Thickness | 2.2 km (1.4 mi) on average,[1] 4.9 km (3.0 mi) at maximum[2] |
| Status | Ongoing net loss of ice, regionally variable[3][4] |
The Antarctic ice sheet is a continental glacier covering 98% of the Antarctic continent, with an area of 14 million square kilometres (5.4 million square miles) and an average thickness of over 2 kilometres (1.2 mi). It is the largest of Earth's two current ice sheets, containing 26.5 million cubic kilometres (6,400,000 cubic miles) of ice, which is equivalent to 61% of all fresh water on Earth. Its surface is nearly continuous, and the only ice-free areas on the continent are the dry valleys, nunataks of the Antarctic mountain ranges, and sparse coastal bedrock. It is often subdivided into the Antarctic Peninsula (AP), the East Antarctic Ice Sheet (EAIS), and the West Antarctic Ice Sheet (WAIS), due to the large differences in glacier mass balance, ice flow, and topography between the three regions.
Because the East Antarctic Ice Sheet is over 10 times larger than the West Antarctic Ice Sheet and located at a higher elevation, it is less vulnerable to climate change than the WAIS. In the 20th century, EAIS had been one of the only places on Earth which displayed limited cooling instead of warming, even as the WAIS warmed by over 0.1 °C/decade from 1950s to 2000, with an average warming trend of >0.05 °C/decade since 1957 across the whole continent. As of early 2020s, there is still net mass gain over the EAIS (due to increased precipitation freezing on top of the ice sheet), yet the ice loss from the WAIS glaciers such as Thwaites and Pine Island Glacier is far greater.
By 2100, net ice loss from Antarctica alone would add around 11 cm (5 in) to the global sea level rise. Further, the way WAIS is located deep below the sea level leaves it vulnerable to marine ice sheet instability, which is difficult to simulate in ice-sheet models. If instability is triggered before 2100, it has the potential to increase total sea level rise caused by Antarctica by tens of centimeters more, particularly with high overall warming. Ice loss from Antarctica also generates fresh meltwater, at a rate of 1100–1500 billion tons (GT) per year. This meltwater dilutes the saline Antarctic bottom water, which weakens the lower cell of the Southern Ocean overturning circulation and may even contribute to its collapse, although this will likely take place over multiple centuries.
Paleoclimate research and improved modelling show that the West Antarctic Ice Sheet is very likely to disappear even if the warming does not progress any further, and only reducing the warming to 2 °C (3.6 °F) below the temperature of 2020 may save it. It is believed that the loss of the ice sheet would take between 2,000 and 13,000 years, although several centuries of high emissions may shorten this to 500 years. 3.3 m (10 ft 10 in) of sea level rise would occur if the ice sheet collapses but leaves ice caps on the mountains behind, and 4.3 m (14 ft 1 in) if those melt as well. Isostatic rebound may also add around 1 m (3 ft 3 in) to the global sea levels over another 1,000 years. On the other hand, the East Antarctic Ice Sheet is far more stable and may only cause 0.5 m (1 ft 8 in) - 0.9 m (2 ft 11 in) of sea level rise from the current level of warming, which is a small fraction of the 53.3 m (175 ft) contained in the full ice sheet. Around 3 °C (5.4 °F), vulnerable locations like Wilkes Basin and Aurora Basin may collapse over a period of around 2,000 years, which would add up to 6.4 m (21 ft 0 in) to sea levels. The loss of the entire ice sheet would require global warming in a range between 5 °C (9.0 °F) and 10 °C (18 °F).
Geography
File:AA bedrock bedmap2.4960.tif
The Antarctic ice sheet covers an area of almost 14 million square kilometres (5.4 million square miles) and contains 26.5 million cubic kilometres (6,400,000 cubic miles) of ice.[6] A cubic kilometer of ice weighs approximately 0.92 metric gigatonnes, meaning that the ice sheet weighs about 24,380,000 gigatonnes. This ice is equivalent to around 61% of all fresh water on Earth.[7] The only other currently existing ice sheet on Earth is the Greenland ice sheet in the Arctic.[8]
The Antarctic ice sheet is divided by the Transantarctic Mountains into two unequal sections called the East Antarctic Ice Sheet (EAIS) and the smaller West Antarctic Ice Sheet (WAIS). Some glaciologists consider ice cover over the relatively small Antarctic Peninsula (also in West Antarctica) to be the third ice sheet in Antarctica,[9][10]: 2234 in part because its drainage basins are very distinct from the WAIS.[4] Collectively, these ice sheets have an average thickness of around 2 kilometres (1.2 mi),[1] Even the Transantarctic Mountains are largely covered by ice, with only some mountain summits and the McMurdo Dry Valleys being ice-free in the present. Some coastal areas also have exposed bedrock that is not covered by ice.[11] During the Late Cenozoic Ice Age, many of those areas had been covered by ice as well.[12][13]
The EAIS rests on a major land mass, but the bed of the WAIS is, in places, more than 2,500 meters (8,200 feet) below sea level. It would be seabed if the ice sheet were not there. The WAIS is classified as a marine-based ice sheet, meaning that its bed lies below sea level and its edges flow into floating ice shelves.[7][14] The WAIS is bounded by the Ross Ice Shelf, the Filchner-Ronne Ice Shelf, and outlet glaciers that drain into the Amundsen Sea.[15] Thwaites Glacier and Pine Island Glacier are the two most important outlet glaciers.[16]
Warming over the ice sheet

Ice loss and accumulation
Near-future sea level rise
Weakening Antarctic circulation

_on_Landsat_9.png)
Ice loss from Antarctica also generates more fresh meltwater, at a rate of 1100–1500 billion tons (GT) per year.[19]: 1240 This meltwater then mixes back into the Southern Ocean, which makes its water fresher.[20] This freshening of the Southern Ocean results in increased stratification and stabilization of its layers,[21][19]: 1240 and this has the single largest impact on the long-term properties of Southern Ocean circulation.[22] These changes in the Southern Ocean cause the upper cell circulation to speed up, accelerating the flow of major currents,[23] while the lower cell circulation slows down, as it is dependent on the highly saline Antarctic bottom water, which already appears to have been observably weakened by the freshening, in spite of the limited recovery during 2010s.[24][25][26][27][19]: 1240 Since the 1970s, the upper cell has strengthened by 3–4 sverdrup (Sv; represents a flow of 1 million cubic meters per second), or 50–60% of its flow, while the lower cell has weakened by a similar amount, but because of its larger volume, these changes represent a 10–20% weakening.[28][29]

While these effects weren't fully caused by climate change, with some role played by the natural cycle of Interdecadal Pacific Oscillation,[30][31] they are likely to worsen in the future. As of early 2020s, climate models' best, limited-confidence estimate is that the lower cell would continue to weaken, while the upper cell may strengthen by around 20% over the 21st century.[19] A key reason for the uncertainty is limited certainty about future ice loss from Antarctica and the poor and inconsistent representation of ocean stratification in even the CMIP6 models - the most advanced generation available as of early 2020s.[32] One study suggests that the circulation would lose half its strength by 2050 under the worst climate change scenario,[22] with greater losses occurring afterwards.[33]
It is possible that the South Ocean overturning circulation may not simply continue to weaken in response to increased warming and freshening, but will eventually collapse outright, in a way which would be difficult to reverse and constitute an example of tipping points in the climate system. This would be similar to some projections for Atlantic meridional overturning circulation (AMOC), which is also affected by the ocean warming and by meltwater flows from the declining Greenland ice sheet.[34] However, Southern Hemisphere is only inhabited by 10% of the world's population, and the Southern Ocean overturning circulation has historically received much less attention than the AMOC. Some preliminary research suggests that such a collapse may become likely once global warming reaches levels between 1.7 °C (3.1 °F) and 3 °C (5.4 °F), but there is far less certainty than with the estimates for most other tipping points in the climate system.[35] Even if initiated in the near future, the circulation's collapse is unlikely to be complete until close to 2300,[36] Similarly, impacts such as the reduction in precipitation in the Southern Hemisphere, with a corresponding increase in the North, or a decline of fisheries in the Southern Ocean with a potential collapse of certain marine ecosystems, are also expected to unfold over multiple centuries.[33]
Long-term future
Situation during geologic time scales

The icing of Antarctica began in the Late Palaeocene or middle Eocene between 60[37] and 45.5 million years ago[38] and escalated during the Eocene–Oligocene extinction event about 34 million years ago. CO2 levels were then about 760 ppm[39] and had been decreasing from earlier levels in the thousands of ppm. Carbon dioxide decrease, with a tipping point of 600 ppm, was the primary agent forcing Antarctic glaciation.[40] The glaciation was favored by an interval when Earth's orbit favored cool summers but oxygen isotope ratio cycle marker changes were too large to be explained by Antarctic ice-sheet growth alone indicating an ice age of some size.[41] The opening of the Drake Passage may have played a role as well[42] though models of the changes suggest declining CO2 levels to have been more important.[43]
The Western Antarctic ice sheet declined somewhat during the warm early Pliocene epoch, approximately five to three million years ago; during this time the Ross Sea opened up.[44] But there was no significant decline in the land-based Eastern Antarctic ice sheet.[45]
See also
- Bibliography of Antarctica
- Filchner-Ronne Ice Shelf
- Geography of Antarctica
- List of glaciers in the Antarctic
- Ross Ice Shelf
- Subglacial lake
References
- ↑ 1.0 1.1 1.2 "Ice Sheets". National Science Foundation. https://www.nsf.gov/geo/opp/antarct/science/icesheet.jsp.
- ↑ 2.0 2.1 Fretwell, P.; Pritchard, H. D.; Vaughan, D. G.; Bamber, J. L.; Barrand, N. E.; Bell, R.; Bianchi, C.; Bingham, R. G. et al. (2013-02-28). "Bedmap2: improved ice bed, surface and thickness datasets for Antarctica". The Cryosphere 7 (1): 375–393. doi:10.5194/tc-7-375-2013. ISSN 1994-0424. Bibcode: 2013TCry....7..375F.
- ↑ IMBIE team (13 June 2018). "Mass balance of the Antarctic Ice Sheet from 1992 to 2017". Nature 558 (7709): 219–222. doi:10.1038/s41586-018-0179-y. PMID 29899482. Bibcode: 2018Natur.558..219I.
- ↑ 4.0 4.1 Rignot, Eric; Mouginot, Jérémie; Scheuchl, Bernd; van den Broeke, Michiel; van Wessem, Melchior J.; Morlighem, Mathieu (22 January 2019). "Four decades of Antarctic Ice Sheet mass balance from 1979–2017". Proceedings of the National Academy of Sciences 116 (4): 1095–1103. doi:10.1073/pnas.1812883116. PMID 30642972. Bibcode: 2019PNAS..116.1095R.
- ↑ 5.0 5.1 Starr, Cindy (4 June 2013). "Antarctic Bedrock: Bedmap2 Surface Elevation". NASA. http://svs.gsfc.nasa.gov/cgi-bin/details.cgi?aid=4060. "Since 2009, NASA's mission Operation IceBridge (OIB) has flown aircraft over the Antarctic Ice Sheet carrying laser and ice-penetrating radar instruments to collect data about the surface height, bedrock topography and ice thickness."
- ↑ Amos, Jonathan (2013-03-08). "Antarctic ice volume measured". BBC News. https://www.bbc.co.uk/news/science-environment-21692423.
- ↑ 7.0 7.1 Fretwell, P. (28 February 2013). "Bedmap2: improved ice bed, surface and thickness datasets for Antarctica". The Cryosphere 7 (1): 390. doi:10.5194/tc-7-375-2013. Bibcode: 2013TCry....7..375F. http://www.the-cryosphere.net/7/375/2013/tc-7-375-2013.pdf. Retrieved 6 January 2014.
- ↑ Robinson, Ben (15 April 2019). "Scientists chart history of Greenland Ice Sheet for first time". https://www.manchester.ac.uk/discover/news/scientists-chart-history-of-greenland-ice-sheet-for-first-time/.
- ↑ Shepherd, Andrew (18 January 2024). "Antarctica and Greenland Ice Sheet Drainage Basins". http://imbie.org/imbie-3/drainage-basins/. ""Antarctica is divided into the West Antarctic Ice Sheet, East Antarctic Ice Sheet and Antarctic Peninsula based on historical definitions plus information from modern-day DEM and ice velocity data.""
- ↑ IPCC, 2021: Annex VII: Glossary [Matthews, J.B.R., V. Möller, R. van Diemen, J.S. Fuglestvedt, V. Masson-Delmotte, C. Méndez, S. Semenov, A. Reisinger (eds.)]. In Climate Change 2021: The Physical Science Basis. Contribution of Working Group I to the Sixth Assessment Report of the Intergovernmental Panel on Climate Change [Masson-Delmotte, V., P. Zhai, A. Pirani, S.L. Connors, C. Péan, S. Berger, N. Caud, Y. Chen, L. Goldfarb, M.I. Gomis, M. Huang, K. Leitzell, E. Lonnoy, J.B.R. Matthews, T.K. Maycock, T. Waterfield, O. Yelekçi, R. Yu, and B. Zhou (eds.)]. Cambridge University Press, Cambridge, United Kingdom and New York, NY, USA, pp. 2215–2256, doi:10.1017/9781009157896.022.
- ↑ Swithinbank, Charles (1988). Williams Jr., Richard S.; Ferrigno, Jane G.. eds. "Glaciers of Antarctica". Satellite Image Atlas of Glaciers of the World U.S. Geological Survey Professional Paper (1386-B). doi:10.3133/pp1386B. Bibcode: 1988usgs.rept...12W. https://pubs.usgs.gov/pp/p1386b/p1386b.pdf.
- ↑ Prentice, Michael L.; Kleman, Johan L.; Stroeven, Arjen P. (1998). "The Composite Glacial Erosional Landscape of the Northern Mcmurdo Dry Valleys: Implications for Antarctic Tertiary Glacial History". Ecosystem Dynamics in a Polar Desert: the Mcmurdo Dry Valleys, Antarctica. American Geophysical Union. pp. 1–38. doi:10.1029/AR072p0001. ISBN 978-1-118-66831-3.
- ↑ Andrew N. Mackintosh; Elie Verleyen; Philip E. O'Brien; Duanne A. White; R. Selwyn Jones; Robert McKay; Robert Dunbar; Damian B. Gore et al. (2014). "Retreat history of the East Antarctic Ice Sheet since the Last Glacial Maximum". Quaternary Science Reviews 100: 10–30. doi:10.1016/j.quascirev.2013.07.024. ISSN 0277-3791. Bibcode: 2014QSRv..100...10M.
- ↑ Hale, George (19 November 2014). "East and West: The Geography of Antarctica". National Aeronautics and Space Administration. https://blogs.nasa.gov/icebridge/2014/11/19/east-and-west-the-geography-of-antarctica/.
- ↑ "Antarctic and Greenland Drainage Systems". Goddard Earth Sciences Division Projects: Cryospheric Sciences. 19 January 2024. https://earth.gsfc.nasa.gov/cryo/data/polar-altimetry/antarctic-and-greenland-drainage-systems. "Our definitions of the West Antarctic ice sheet (systems 18-23 and 1), the East Antarctic ice sheet (systems 2-17), and the Antarctic Peninsula (systems 24-27) allocate the drainage systems according to ice provenance with separation of East and West Antarctica approximately along the Transantarctic Mountains."
- ↑ "The "Unstable" West Antarctic Ice Sheet: A Primer". NASA. 12 May 2014. https://www.nasa.gov/jpl/news/antarctic-ice-sheet-20140512/.
- ↑ "Facts / Vital signs / Ice Sheets / Antarctica Mass Variation Since 2002". NASA. January 2025. https://climate.nasa.gov/vital-signs/ice-sheets/. (Time between NASA's GRACE and GRACE Follow-On satellite projects caused gap in data. Publication lags most recent charted data by a few months.)
- ↑ Pellichero, Violaine; Sallée, Jean-Baptiste; Chapman, Christopher C.; Downes, Stephanie M. (3 May 2018). "The southern ocean meridional overturning in the sea-ice sector is driven by freshwater fluxes". Nature Communications 9 (1): 1789. doi:10.1038/s41467-018-04101-2. PMID 29724994. Bibcode: 2018NatCo...9.1789P.
- ↑ 19.0 19.1 19.2 19.3 19.4 Fox-Kemper, B.; Hewitt, H.T.; Xiao, C.; Aðalgeirsdóttir, G.; Drijfhout, S.S.; Edwards, T.L.; Golledge, N.R.; Hemer, M. et al. (2021). "Ocean, Cryosphere and Sea Level Change". in Masson-Delmotte, V.; Zhai, P.; Pirani, A. et al.. Climate Change 2021: The Physical Science Basis. Contribution of Working Group I. Sixth Assessment Report of the Intergovernmental Panel on Climate Change. 2021. Cambridge University Press. pp. 1239–1241. doi:10.1017/9781009157896.011. ISBN 978-1-009-15789-6. https://www.ipcc.ch/report/ar6/wg1/chapter/chapter-9/.
- ↑ Pan, Xianliang L.; Li, Bofeng F.; Watanabe, Yutaka W. (10 January 2022). "Intense ocean freshening from melting glacier around the Antarctica during early twenty-first century" (in en). Scientific Reports 12 (1): 383. doi:10.1038/s41598-021-04231-6. ISSN 2045-2322. PMID 35013425. Bibcode: 2022NatSR..12..383P.
- ↑ Haumann, F. Alexander; Gruber, Nicolas; Münnich, Matthias; Frenger, Ivy; Kern, Stefan (September 2016). "Sea-ice transport driving Southern Ocean salinity and its recent trends" (in en). Nature 537 (7618): 89–92. doi:10.1038/nature19101. ISSN 1476-4687. PMID 27582222. Bibcode: 2016Natur.537...89H. https://www.nature.com/articles/nature19101.
- ↑ 22.0 22.1 Li, Qian; England, Matthew H.; Hogg, Andrew McC.; Rintoul, Stephen R.; Morrison, Adele K. (29 March 2023). "Abyssal ocean overturning slowdown and warming driven by Antarctic meltwater". Nature 615 (7954): 841–847. doi:10.1038/s41586-023-05762-w. PMID 36991191. Bibcode: 2023Natur.615..841L.
- ↑ Shi, Jia-Rui; Talley, Lynne D.; Xie, Shang-Ping; Peng, Qihua; Liu, Wei (2021-11-29). "Ocean warming and accelerating Southern Ocean zonal flow". Nature Climate Change (Springer Science and Business Media LLC) 11 (12): 1090–1097. doi:10.1038/s41558-021-01212-5. ISSN 1758-678X. Bibcode: 2021NatCC..11.1090S.
- ↑ Silvano, Alessandro; Rintoul, Stephen Rich; Peña-Molino, Beatriz; Hobbs, William Richard; van Wijk, Esmee; Aoki, Shigeru; Tamura, Takeshi; Williams, Guy Darvall (18 April 2018). "Freshening by glacial meltwater enhances the melting of ice shelves and reduces the formation of Antarctic Bottom Water". Science Advances 4 (4). doi:10.1126/sciadv.aap9467. PMID 29675467.
- ↑ Ribeiro, N.; Herraiz-Borreguero, L.; Rintoul, S. R.; McMahon, C. R.; Hindell, M.; Harcourt, R.; Williams, G. (15 July 2021). "Warm Modified Circumpolar Deep Water Intrusions Drive Ice Shelf Melt and Inhibit Dense Shelf Water Formation in Vincennes Bay, East Antarctica" (in en). Journal of Geophysical Research: Oceans 126 (8). doi:10.1029/2020JC016998. ISSN 2169-9275. Bibcode: 2021JGRC..12616998R.
- ↑ Aoki, S.; Yamazaki, K.; Hirano, D.; Katsumata, K.; Shimada, K.; Kitade, Y.; Sasaki, H.; Murase, H. (15 September 2020). "Reversal of freshening trend of Antarctic Bottom Water in the Australian-Antarctic Basin during 2010s" (in en). Scientific Reports 10 (1): 14415. doi:10.1038/s41598-020-71290-6. PMID 32934273.
- ↑ Gunn, Kathryn L.; Rintoul, Stephen R.; England, Matthew H.; Bowen, Melissa M. (25 May 2023). "Recent reduced abyssal overturning and ventilation in the Australian Antarctic Basin" (in en). Nature Climate Change 13 (6): 537–544. doi:10.1038/s41558-023-01667-8. ISSN 1758-6798. Bibcode: 2023NatCC..13..537G.
- ↑ Lee, Sang-Ki; Lumpkin, Rick; Gomez, Fabian; Yeager, Stephen; Lopez, Hosmay; Takglis, Filippos; Dong, Shenfu; Aguiar, Wilton et al. (13 March 2023). "Human-induced changes in the global meridional overturning circulation are emerging from the Southern Ocean". Communications Earth & Environment 4 (1): 69. doi:10.1038/s43247-023-00727-3. Bibcode: 2023ComEE...4...69L.
- ↑ 29.0 29.1 "NOAA Scientists Detect a Reshaping of the Meridional Overturning Circulation in the Southern Ocean". NOAA. 29 March 2023. https://www.aoml.noaa.gov/noaa-scientists-detect-reshaping-of-the-meridional-overturning-circulation-in-southern-ocean/.
- ↑ Zhou, Shenjie; Meijers, Andrew J. S.; Meredith, Michael P.; Abrahamsen, E. Povl; Holland, Paul R.; Silvano, Alessandro; Sallée, Jean-Baptiste; Østerhus, Svein (12 June 2023). "Slowdown of Antarctic Bottom Water export driven by climatic wind and sea-ice changes". Nature Climate Change 13 (6): 701–709. doi:10.1038/s41558-023-01667-8. Bibcode: 2023NatCC..13..537G.
- ↑ Silvano, Alessandro; Meijers, Andrew J. S.; Zhou, Shenjie (17 June 2023). "Slowing deep Southern Ocean current may be linked to natural climate cycle—but melting Antarctic ice is still a concern". The Conversation. https://theconversation.com/slowing-deep-southern-ocean-current-may-be-linked-to-natural-climate-cycle-but-thats-no-reason-to-stop-worrying-about-melting-antarctic-ice-205341.
- ↑ Bourgeois, Timothée; Goris, Nadine; Schwinger, Jörg; Tjiputra, Jerry F. (17 January 2022). "Stratification constrains future heat and carbon uptake in the Southern Ocean between 30°S and 55°S". Nature Communications 13 (1): 340. doi:10.1038/s41467-022-27979-5. PMID 35039511. Bibcode: 2022NatCo..13..340B.
- ↑ 33.0 33.1 Logan, Tyne (29 March 2023). "Landmark study projects 'dramatic' changes to Southern Ocean by 2050". ABC News. https://www.abc.net.au/news/2023-03-30/dramatic-south-ocean-circulation-changes-study/102154690.
- ↑ Bakker, P; Schmittner, A; Lenaerts, JT; Abe-Ouchi, A; Bi, D; van den Broeke, MR; Chan, WL; Hu, A et al. (11 November 2016). "Fate of the Atlantic Meridional Overturning Circulation: Strong decline under continued warming and Greenland melting". Geophysical Research Letters 43 (23): 12,252–12,260. doi:10.1002/2016GL070457. Bibcode: 2016GeoRL..4312252B.
- ↑ Lenton, T. M.; Armstrong McKay, D.I.; Loriani, S.; Abrams, J.F.; Lade, S.J.; Donges, J.F.; Milkoreit, M.; Powell, T. et al. (2023). The Global Tipping Points Report 2023 (Report). University of Exeter. https://global-tipping-points.org/download/4608/.
- ↑ Liu, Y.; Moore, J. K.; Primeau, F.; Wang, W. L. (22 December 2022). "Reduced CO2 uptake and growing nutrient sequestration from slowing overturning circulation". Nature Climate Change 13: 83–90. doi:10.1038/s41558-022-01555-7.
- ↑ Barr, Iestyn D.; Spagnolo, Matteo; Rea, Brice R.; Bingham, Robert G.; Oien, Rachel P.; Adamson, Kathryn; Ely, Jeremy C.; Mullan, Donal J. et al. (21 September 2022). "60 million years of glaciation in the Transantarctic Mountains" (in en). Nature Communications 13 (1): 5526. doi:10.1038/s41467-022-33310-z. ISSN 2041-1723. PMID 36130952. Bibcode: 2022NatCo..13.5526B.
- ↑ Sedimentological evidence for the formation of an East Antarctic ice sheet in Eocene/Oligocene time Palaeogeography, palaeoclimatology, & palaeoecology ISSN 0031-0182, 1992, vol. 93, no1-2, pp. 85–112 (3 p.)
- ↑ "New CO2 data helps unlock the secrets of Antarctic formation" (in en). September 13, 2009. https://phys.org/news/2009-09-co2-secrets-antarctic-formation.html.
- ↑ Pagani, M.; Huber, M.; Liu, Z.; Bohaty, S. M.; Henderiks, J.; Sijp, W.; Krishnan, S.; Deconto, R. M. (2011). "Drop in carbon dioxide levels led to polar ice sheet, study finds". Science 334 (6060): 1261–1264. doi:10.1126/science.1203909. PMID 22144622. Bibcode: 2011Sci...334.1261P. https://www.sciencedaily.com/releases/2011/12/111201174225.htm. Retrieved 2014-01-28.
- ↑ Coxall, Helen K. (2005). "Rapid stepwise onset of Antarctic glaciation and deeper calcite compensation in the Pacific Ocean". Nature 433 (7021): 53–57. doi:10.1038/nature03135. PMID 15635407. Bibcode: 2005Natur.433...53C.
- ↑ Diester-Haass, Liselotte; Zahn, Rainer (1996). "Eocene-Oligocene transition in the Southern Ocean: History of water mass circulation and biological productivity". Geology 24 (2): 163. doi:10.1130/0091-7613(1996)024<0163:EOTITS>2.3.CO;2. Bibcode: 1996Geo....24..163D.
- ↑ DeConto, Robert M. (2003). "Rapid Cenozoic glaciation of Antarctica induced by declining atmospheric CO2". Nature 421 (6920): 245–249. doi:10.1038/nature01290. PMID 12529638. Bibcode: 2003Natur.421..245D. http://doc.rero.ch/record/16546/files/PAL_E3220.pdf.
- ↑ Naish, Timothy (2009). "Obliquity-paced Pliocene West Antarctic ice sheet oscillations". Nature 458 (7236): 322–328. doi:10.1038/nature07867. PMID 19295607. Bibcode: 2009Natur.458..322N. https://digitalcommons.unl.edu/cgi/viewcontent.cgi?httpsredir=1&article=1186&context=geosciencefacpub.
- ↑ Shakun, Jeremy D. (2018). "Minimal East Antarctic Ice Sheet retreat onto land during the past eight million years". Nature 558 (7709): 284–287. doi:10.1038/s41586-018-0155-6. PMID 29899483. Bibcode: 2018Natur.558..284S. https://www.osti.gov/biblio/1905199.
| Scholia has a topic profile for Antarctic ice sheet. |
| General |
|  |
|---|---|---|
| Geographic regions | ||
| Waterways | ||
| Famous explorers | ||
 |  |
