Engineering:Tire uniformity
Tire uniformity refers to the dynamic mechanical properties of pneumatic tires as strictly defined by a set of measurement standards and test conditions accepted by global tire and car makers.
These standards include the parameters of radial force variation, lateral force variation, conicity, ply steer, radial run-out, lateral run-out, and sidewall bulge. Tire makers worldwide employ tire uniformity measurement as a way to identify poorly performing tires so they are not sold to the marketplace. Both tire and vehicle manufacturers seek to improve tire uniformity in order to improve vehicle ride comfort.
Force variation background
The circumference of the tire can be modeled as a series of very small spring elements whose spring constants vary according to manufacturing conditions. These spring elements are compressed as they enter the road contact area, and recover as they exit the footprint. Variation in the spring constants in both radial and lateral directions cause variations in the compressive and restorative forces as the tire rotates. Given a perfect tire, running on a perfectly smooth roadway, the force exerted between the car and the tire will be constant. However, a normally manufactured tire running on a perfectly smooth roadway will exert a varying force into the vehicle that will repeat every rotation of the tire. This variation is the source of various ride disturbances. Both tire and car makers seek to reduce such disturbances in order to improve the dynamic performance of the vehicle.
Tire uniformity parameters
Axes of measurement

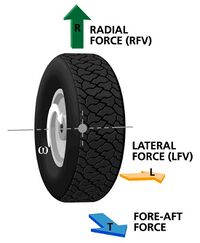
Tire forces are divided into three axes: radial, lateral, and tangential (or fore-aft). The radial axis runs from the tire center toward the tread, and is the vertical axis running from the roadway through the tire center toward the vehicle. This axis supports the vehicle's weight. The lateral axis runs sideways across the tread. This axis is parallel to the tire mounting axle on the vehicle. The tangential axis is the one in the direction of the tire travel.
Radial force variation
In so far as the radial force is the one acting upward to support the vehicle, radial force variation describes the change in this force as the tire rotates under load. As the tire rotates and spring elements with different spring constants enter and exit the contact area, the force will change. Consider a tire supporting a 4,000 N (900 lbf) load running on a perfectly smooth roadway. It would be typical for the force to vary up and down from this value. A variation between 3,900 and 4,100 N (880 and 920 lbf) would be characterized as an 200 N (40 lbf) radial force variation (RFV). The radial force variation can be expressed as a peak-to-peak value, which is the maximum minus minimum value, or any harmonic value as described below.
Some tire manufactures mark the sidewall with a red dot to indicate the location of maximal radial force and runout, the high spot. A yellow dot indicates the point of least weight.[1] Use of the dots is specified in Technology Maintenance Council's RP243 performance standard. To compensate for this variation, tires are supposed to be installed with the red dot near the valve stem, assuming the valve stem is at the low point, or with the yellow dot near the valve stem, assuming the valve stem is at the heavy point.[2]
Harmonic analysis

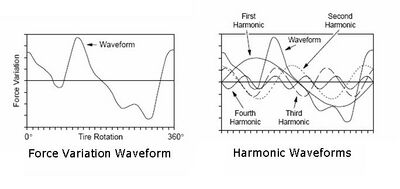
Radial force variation, as well as all other force variation measurements, can be shown as a complex waveform. This waveform can be expressed according to its harmonics by applying Fourier transform (FT). FT permits one to parameterize various aspects of the tire dynamic behavior. The first harmonic, expressed as radial force first harmonic (RF1H) describes the force variation magnitude that exerts a pulse into the vehicle one time for each rotation. Radial force second harmonic (RF2H) expresses the magnitude of the radial force that exerts a pulse twice per revolution, and so on. Often, these harmonics have known causes, and can be used to diagnose production problems. For example, a tire mold installed with 8 segments may thermally deform as to induce an eighth harmonic, so the presence of a high radial force eight harmonic (RF8H) would point to a mold sector parting problem. RF1H is the primary source of ride disturbances, followed by RF2H. High harmonics are less problematic because the rotating speed of the tire at highway speeds times the harmonic value makes disturbances at such high frequencies that they are damped or overcome by other vehicle dynamic conditions.
Lateral force variation
Insofar as the lateral force is the one acting side-to-side along the tire axle, lateral force variation describes the change in this force as the tire rotates under load. As the tire rotates and spring elements with different spring constants enter and exit the contact area, the lateral force will change. As the tire rotates it may exert a lateral force on the order of 100 N (22 lbf), causing steering pull in one direction. It would be typical for the force to vary up and down from this value. A variation between 90 and 110 N (20 and 25 lbf) would be characterized as a 20 N (5 lbf) lateral force variation (LFV). The lateral force variation can be expressed as a peak-to-peak value, which is the maximum minus minimum value, or any harmonic value as described above. Lateral force is signed, such that when mounted on the vehicle, the lateral force may be positive, making the vehicle pull to the left, or negative, pulling to the right.
Tangential force variation
Insofar as the tangential force is the one acting in the direction of travel, tangential force variation describes the change in this force as the tire rotates under load. As the tire rotates and spring elements with different spring constants enter and exit the contact area, the tangential force will change. As the tire rotates it exerts a high traction force to accelerate the vehicle and maintain its speed under constant velocity. Under steady-state conditions it would be typical for the force to vary up and down from this value. This variation would be characterized as tangential force variation (TFV). In a constant velocity test condition, the tangential force variation would be manifested as a small speed fluctuation occurring every rotation due to the change in rolling radius of the tire.
Conicity
Conicity is a parameter based on lateral force behavior. It is the characteristic that describes the tire's tendency to roll like a cone. This tendency affects the steering performance of the vehicle.[3] In order to determine conicity, lateral force must be measured in both clockwise (LFCW) and counterclockwise direction (LFCCW). Conicity is calculated as one-half the difference of the values, keeping in mind that clockwise and counterclockwise values have opposite signs. Conicity is an important parameter in production testing. In many high-performance cars, tires with equal conicity are mounted on left and right sides of the car in order that their conicity effects will cancel each other and generate a smoother ride performance, with little steering effect. This necessitates the tire maker measuring conicity and sorting tires into groups of like-values.
Ply steer
Ply steer describes the lateral force a tire generates due to asymmetries in its carcass as is rolls forward with zero slip angle and may be called pseudo side slip.[4] It is the characteristic that is usually described as the tire's tendency to “crab walk”, or move sideways while maintaining a straight-line orientation. This tendency affects the steering performance of the vehicle. In order to determine ply steer, the lateral force generated is measured as the tire rolls both forward and back, and ply steer is then calculated as one-half the sum of the values, keeping in mind that values have opposite signs.
Radial run-out
Radial run-out (RRO) describes the deviation of the tire's roundness from a perfect circle. The radial run-out can be expressed as the peak-to-peak value as well as harmonic values. Radial run-out imparts an excitation into the vehicle in a manner similar to radial force variation. It is most often measured near the tire's centerline, although some tire makers have adopted measurement of radial run-out at three positions: left shoulder, center, and right shoulder.
Some tire manufactures mark the sidewall with a red dot to indicate the location of maximal radial force and runout.[2]
Lateral run-out
Lateral run-out (LRO) describes the deviation of the tire's sidewall from a perfect plane. LRO can be expressed as the peak-to-peak value as well as harmonic values. LRO imparts an excitation into the vehicle in a manner similar to lateral force variation. LRO is most often measured in the upper sidewall, near the tread shoulder.
Sidewall bulge and depression
Given that the tire is an assembly of multiple components that are cured in a mold, there are many process variations that cause cured tires to be classified as rejects. Bulges and depressions in the sidewall are such defects. A bulge is a weak spot in the sidewall that expands when the tire is inflated. A depression is a strong spot that does not expand in equal measure as the surrounding area. Both are deemed visual defects. Tires are measured in production to identify those with excessive visual defects. Bulges may also indicate defective construction conditions such as missing cords, which pose a safety hazard. As a result, tire makers impose stringent inspection standards to identify tires with bulges. Sidewall Bulge and Depression is also referred to as bulge and dent, and bumpy sidewall.
Tire uniformity measurement machines
Tire uniformity machines are special-purpose machines that automatically inspect tires for the tire uniformity parameters described above. They consist of several subsystems, including tire handling, chucking, measurement rims, bead lubrication, inflation, load wheel, spindle drive, force measurement, and geometry measurement.
The tire is first centered, and the bead areas are lubricated to assure a smooth fitment to the measurement rims. The tire is indexed into the test station and placed on the lower chuck. The upper chuck lowers to make contact with the upper bead. The tire is inflated to the set point pressure. The load wheel advances to contact the tire and apply the set loading force. The spindle drive accelerates the tire to the test speed. Once speed, force, and pressure are stable, load cells measure the force exerted on the load wheel by the tire. The force signal is processed in analog circuitry, and then analyzed to extract the measurement parameters. Tires are marked according to various standards that may include radial force variation (RFV) high point angle, side of positive conicity, and conicity magnitude.
Other types of uniformity machines
There are numerous variations and innovations among several tire uniformity machine makers. The standard test speed for tire uniformity machines is 60 r/min of a standard load wheel that approximates 5 miles per hour. High speed uniformity machines are used in research and development environments that reach 250 km/h and higher. High speed uniformity machines have also been introduced for production testing. Machines that combine force variation measurement with dynamic balance measurement are also in use.
Tire uniformity correction
Radial and lateral force variation can be reduced at the tire uniformity machine via grinding operations. In the center grind operation, a grinder is applied to the tread center to remove rubber at the high point of radial force variation. On the top and bottom tread shoulder grinders are applied to reduce the size of the road contact area, or footprint, and the resulting force variation. Top and bottom grinders can be controlled independently to reduce conicity values. Grinders are also employed to correct excessive radial run-out.
Effects of tire variations can also be reduced by mounting the tire in such a way that unbalanced rims and valve stems helps compensate for imperfect tires.[2]
Geometry measurement systems
Radial run-out, lateral run-out, conicity, and bulge measurements are also performed on the tire uniformity machine. There are several generations of measurement technologies in use. These include Contact Stylus, Capacitive Sensors, Fixed-Point Laser Sensors, and Sheet-of-Light Laser Sensors.
Contact stylus
Contact Stylus technology utilizes a touch-probe to ride along the tire surface as it rotates. Analog instrumentation senses the movement of the probe, and records the run-out waveform. When used to measure radial runout, the stylus is fitted to a large-area paddle that can span the voids in the tread pattern. When used to measure lateral runout on the sidewall the stylus runs in a very narrow smooth track. The contact stylus method is one of the earliest technologies, and requires considerable effort to maintain its mechanical performance. The small area-of-interest in the sidewall area limits the effectiveness in discerning sidewall bulges and depressions elsewhere on the sidewall.
Capacitive sensors
Capacitive Sensors generate a dielectric field between the tire and sensor. As the distance between the tire and the sensor varies, the voltage and/or current properties of the dielectric field change. Analog circuitry is employed to measure the field changes and record the run-out waveform. Capacitive sensors have a larger area-of-interest, on the order of 10mm compared to the very narrow contact stylus method. The capacitive sensor method is one of the earliest technologies, and has proven highly reliable; however, the sensor must be positioned very close to the tire surface during measurement, so collisions between tire and sensor have led to long-term maintenance problems. In addition, some sensors are very sensitive to moisture/humidity and ended with erroneous readings. The 10mm area-of-interest also means that bulge measurement is limited to a small portion of the tire. Capacitive sensors employ void filtering to remove the effect of the voids between the tread lugs in radial runout measurement, and letter filtering to remove the effect of raised letters and ornamentation on the sidewall.
Fixed-point laser sensors
Fixed-Point Laser Sensors were developed as an alternative to the above methods. Lasers combine the narrow-track area-of-interest with a large stand off distance from the tire. In order to cover a larger area-of-interest, mechanical positioning systems have been employed to take readings at multiple positions in the sidewall. Fixed-Point Laser sensors employ void filtering to remove the effect of the voids between the tread lugs in radial run-out measurement, and letter filtering to remove the effect of raised letters and ornamentation on the sidewall.
Sheet-of-light laser systems

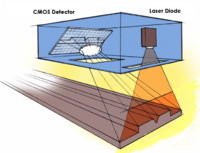
Sheet-of-light laser (SL) systems were introduced in 2003, and have emerged as the most capable and reliable run-out, bulge and depression measurement methods. Sheet-of-light sensors project a laser line instead of a laser point, and thereby create a very large area-of-interest. Sidewall sensors can easily span an area from the bead area to the tread shoulder, and inspect the complete sidewall for bulge and depression defects. Large radial sensors can span 300mm or more to cover the entire tread width. This enables characterization of RRO in multiple tracks. Sheet-of-light sensors also feature stand off distances large enough to assure no collisions with the tire. Two-dimensional tread void filtering and sidewall letter filtering are also employed to eliminate these characteristics from the runout measurements.
References
- ↑ Mike Marvigian (April 2008). "Tire Match Mounting and Custom Wheel Handling". Motor. https://www.motor.com/magazinepdfs/042008_09.pdf. Retrieved September 11, 2017.
- ↑ 2.0 2.1 2.2 "Are you seeing dots? Those color-coded sidewall markings serve a purpose". Tire Business. Crain Communications. 2 September 2012. http://www.tirebusiness.com/article/20070813/ISSUE/308139967/are-you-seeing-dots-those-color-coded-sidewall-markings-serve-a-purpose. Retrieved September 9, 2017.
- ↑ "AGCO Automotive Repair Service - Baton Rouge, LA - Detailed Auto Topics - Tire Conicity and Radial Pull". http://www.agcoauto.com/content/news/p2_articleid/181.
- ↑ Pacejka, Hans B. (2006). Tyre and vehicle dynamics (2nd ed.). SAE International. pp. 198. ISBN 978-0-7680-1702-1. "ply steer is sometimes referred to as pseudo side slip."
 |
