Physics:KinITC
What is kinITC ?
The method kinITC for kinetic Isothermal Titration Calorimetry is an extension of the classical ITC technique in view of obtaining kinetic information in addition to thermodynamic information. It has been described in full in,[1] and in a simplified and less general form in.[2] In short, kinITC allows obtaining with a single technique both the information obtained with classical ITC and with a technique like Surface Plasmon Resonance (SPR). In situations where a chemical reaction proceeds clearly through two successive kinetic steps, the major interest of kinITC is of being potentially more informative alone[1] than ITC and SPR used jointly, but in a classical way. The experimental limitation for its successful application comes from the response time of the instrument, which prevents from obtaining kinetic information if the reaction proceeds too rapidly. It turns out that this is not so much a severe limitation for many reactions occurring with biological macromolecules. The kinITC method is thus quite appropriate in biology. Note that, as pionereed long time ago by J. Sturtevant, ITC has already been used for deriving kinetic information in biochemistry, but only in the particular situations of enzyme kinetics.[3]
Basic reminder on ITC
Classical ITC is a typical thermodynamic technique allowing to measure directly the heat evolved during a reaction that can be described by:
A + B ↔ C (1)
At constant pressure, the heat evolved during the formation of one mole of the product C is nothing else than ΔH, the molar variation of enthalpy of the reaction. By considering a titration experiment during which small amounts of the compound B are injected at regular intervals into a measurement cell containing the compound A, one can determine the equilibrium constant Ka of the reaction (in M−1) or, equivalently, the dissociation constant Kd = Ka−1 (in M). From this, the standard Gibbs free energy of the reaction may be obtained:
ΔG° = ΔH° - TΔS° = RT lnKd (2)
and thus also ΔS° = (ΔH° - ΔG° )/T. As important the four quantities ΔH°, ΔG°, ΔS° and Kd may be, particularly for drug design,[4] it is important to emphasize that they are typical thermodynamic quantities that do not say anything about the kinetics of the reaction.
How to overcome this limitation ?
An important feature of ITC is that the instrument does not measure directly the total heat Q evolved during the reaction, but its rate of production (or absorption) during the reaction. Therefore, the primary signal is the heat power:
Ps(t) = dQ/dt (3)
and this is only by integrating Ps(t) that Q can be obtained. By definition of ΔH, one has therefore a direct link between Ps(t) and d[C]/dt, the rate of production of the compound C:
Ps(t)= Vcell ΔH d[C]/dt (4)
where Vcell is the volume of the cell where the reaction takes place. Therefore, knowing Ps(t) yields d[C] /dt, which opens the way for obtaining kinetic information.
Simplified analysis for the evaluation of d[C]/dt
The kinetics of the bimolecular reaction A + B ↔ C is governed by the two parameters kon and koff which leads to:
d[C] /dt = kon [A] [B] - koff [C] (5)
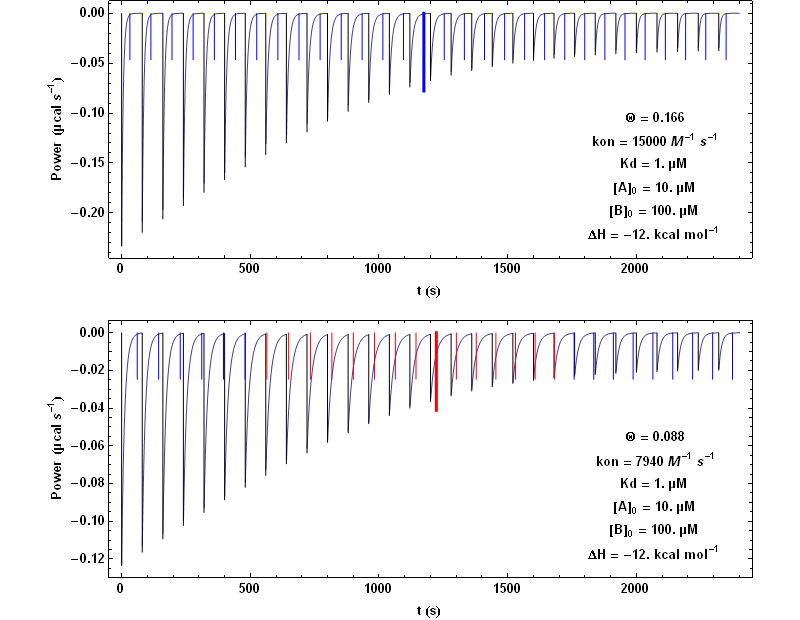
This equation may be complemented with two conservation equations: [A] +[C] = [A]0 and [B] +[C] = [B]0 , [A]0 and [B]0 being the total concentrations of the compounds A and B at the beginning of the reaction. These two concentrations [A]0 and [B]0 vary during each injection of compound B (which typically lasts more than 0.5 s and less than 3 to 4 s), but are constant between two successive injections (separated by much longer times). We consider here a simplified situation where the short injection time is neglected, which means that [A]0 and [B]0 are constant during each titration step. In addition, the problem of the finite response time of the instrument is also neglected. It is explained in the following how these limitations can be suppressed. Within this simplified frame, an analytical solution to equation (5) can be obtained. This is illustrated with Fig. 1 highlighting two simulations with two different values of kon.

In Fig. 1, each step following the injection of 1.3 µl of compound B lasts 80 s. The vertical bars mark the theoretical value of the time needed to reach equilibrium at each titration step. It is seen that with the higher kon value of 15000 M-1 s-1 (upper figure) the time interval of 80 s is always sufficient for returning to equilibrium, whereas with the lower kon value of 7940 M-1 s-1, it becomes too short (red bars) for some injections. The thickest and longest bar marks mid-titration, that is the titration step closest to a unit stoichiometry ([A] = [B]). It can be shown that this corresponds to the step with the slowest return to equilibrium.
The practical problems
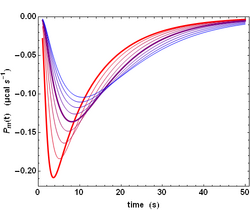
The previous analysis is a simplified one because the power signal Ps(t) given by equation (4) does not correspond to the actually measured power Pm(t). There are two reasons for that. First, neither the injection, nor the mixing of compound B are instantaneous. Second, the ITC instrument has also a finite response time τITC, which implies that a sudden heat signal Ps(t) delivered into the measurement cell will in fact give rise to an actually measured signal Pm(t) decreasing exponentially with a characteristic time τITC. Such a response is named the impulse response. These two complications can nevertheless be dealt with by using standard methods in signal processing. Essentially, the actual signal is obtained by a Convolution of the ideal signal with the impulse response function. This is exemplified with the influence of τITC on the shape of the actually measured signal Pm(t)(Fig. 2). The influence of all parameters can be visualized on kinITCdemo.

.
The practical consequence of such a convolution is a smoothing of the actual signal (compare the sharp ideal response curves in Fig. 1 with the realistic response curves in Fig. 2). Importantly, the convolution operation "dilutes" the power response curve, but does not change its time-integral, which corresponds to the total heat evolved during the titration step.
Obtaining the kinetic parameters kon and koff in simple situations
When one is able to simulate accurately all response curves of a titration experiment, it becomes possible to fit the experimental response curves and, in turn, to derive the kinetic parameters kon and koff that influence the return to equilibrium (see Fig. 1). This is obviously possible for reactions that are correctly described with one single kinetic step. Examples of such fits are shown on kinITCdemo. It is important to emphasize that a convincing result is obtained by considering experiments at different temperatures and by fitting all titration steps of all experiments with a single set of thermodynamic and kinetic parameters. Two features are particularly important for the success of the method. First, the kinetic parameters kon and koff are linked at all temperatures to the equilibrium 'constant' through Ka = kon/koff (or Kd = koff/kon) and, second, the evolution of these equilibrium 'constants' with the temperature is rigorously governed by the Van 't Hoff equation: ∂ln Ka/∂T = ΔH/RT2 (or ∂ln Kd/∂T = -ΔH/RT2). Since the enthalpic term ΔH is the primary result obtained by ITC, the experimental method itself dictates the evolution of Ka(T), that is also of kon(T)/koff(T). Therefore, either kon(T) or koff(T) needs to be considered as unknown, since their ratio is known. It is useful to parameterize the unknown temperature-dependence of this kinetic parameter with the Arrhenius equation. If, for example, koff(T) is considered as unknown, the determination of only two parameters, namely the value of koff at a reference temperature T0, and an activation energy ΔH‡off, should allow fitting all titration steps of experiments at all temperatures. How many different temperatures should be considered? In practice, experiments at two different temperatures may be sufficient if there is a linear variation of ΔH vs. T, i.e. if ∂ΔH/∂T = ΔCp = constant, which is often (but not always!) the case. Note that, indeed, at variance with a common assumption in many textbooks, ΔH is most often variable with the temperature (∂ΔH/∂T = ΔCp ≠ 0), and this has to be taken into account for obtaining Ka(T) from the Van 't Hoff equation.
The interest of kinITC for more complex situations
If, for example, a chemical process cannot be represented by equation (1), but needs to be represented by:
A + B ↔ C1 ↔ C2 (6)
all usual experimental methods used alone yield information on the global process A + B ↔ C2, which ignores the intermediate step. On the contrary, as shown in,[1] kinITC used alone is able to dissect such a composite process both thermodynamically and kinetically. This means that kinITC allows dissecting the overall enthalpic term ΔH1+2 (obtained by a classical use of ITC) into ΔH1 + ΔH2, where ΔH1 pertains to the first step A + B ↔ C1, and ΔH2 pertains to the second step C1 ↔ C2. Furthermore, the two steps are also dissected kinetically, which means that the kinetic parameters kon and koff for the first step, as well as k1,2 and k2,1 for the second step, are also obtained. Obviously, on one hand, obtaining such a wealth of information has a price in terms of the number of experiments that should be performed at different temperatures (at least three, but the exact number depends on the quality of the data and on whether or not ΔCp is constant). On the other hand, one is rewarded by a complete knowledge of all parameters, comprising their temperature dependence.
See also
References
- ↑ 1.0 1.1 1.2 Burnouf D., Ennifar E. et al., kinITC: a new method for obtaining joint thermodynamic and kinetic data by Isothermal Titration Calorimetry. JACS 134(2012)559-565
- ↑ Vander Meulen K.A., Butcher S.E., Characterization of the kinetic and thermodynamic landscape of RNA folding using a novel application of isothermal titration calorimetry. Nucleic Acids Res. 40(2011)2140-51
- ↑ Bianconi M.L., Calorimetry of enzyme-catalyzed reactions. Biophysical Chemistry 126(2007)59-64
- ↑ Chaires J.B., Thermodynamics in drug design. Annu. Rev. Biophys. 37(2008)135-151
External links
- kinITCdemo
- An implementation of kinITC is available in the software AFFINImeter
