Point pattern analysis
Point pattern analysis (PPA)[1] is the study of point patterns, the spatial arrangements of points in space (usually 2-dimensional space). The simplest formulation is a set X = {x ∈ D} where D, which can be called the 'study region,' is a subset of Rn, a n-dimensional Euclidean space.
Description
The easiest way to visualize a 2-D point pattern is a map of the locations, which is simply a scatterplot but with the provision that the axes are equally scaled. If D is not the boundary of the map then it should also be indicated. An empirical definition of D would be the convex hull of the points, or at least their bounding box, a matrix of the ranges of the coordinates. Another straightforward way to visualize the points is a 2D histogram (sometimes called a quadrats) that bins the points into rectangular regions. A benefit of quadrat analysis is that it forces the analysis to take into account possible scales within which statistically significant inhomogeneities may be occurring.
Modeling
The null model for point patterns is complete spatial randomness (CSR), modeled as a Poisson process in Rn, which implies that the number of points in any arbitrary region A in D will be proportional to the area or volume of A. Exploring models is generally iterative: if CSR is accepted not much more can be said, but if rejected, there are two avenues. First, one must decide which models are worth exploring, such as investigations of clustering, density, trends, etc. And for each of these models there are appropriate scale ranges, from the finest, which essentially mirrors the point pattern, to the coarsest, which aggregates D. It is generally interesting to explore a range of scales within these limits. A particularly robust model of clustered point patterns is diffusion, which can also be thought of as the trajectory of a point doing a random walk.
Estimation

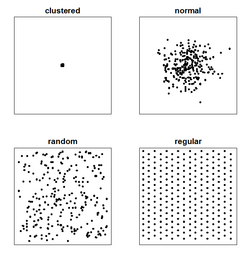
A fundamental problem of PPA is inferring whether a given arrangement is merely random or the result of some process. The picture illustrates patterns of 256 points using four point processes. The clustered process results in all points having the same location. Popular models are those based on simple circles and ellipses, inter-point (and especially nearest neighbor) distances, quadrats, and intensity functions. Each model yields estimates (that can increase insights into the underlying real-world processes) as well as associated goodness-of-fit diagnostics.
Applications
PPA has applications in a wide range of areas, including astronomy, archaeology,[2][3] geography, ecology, biology, and epidemiology. A few topics in the last area are discussed here.
- A case control study compares the point patterns of organisms both with and without some condition to determine if there were significant differences in their arrangements.
- Environmental exposure examines the locations of cases and possible sources (e.g. of pollution or carcinogens).
- Contagion explores the temporal unfolding of the pattern, asking about such phenomena as the location of the 'index case.'
- Examination of infection compares the arrangements of parasites and hosts (predators and prey, agents and organisms).
- Analysis of the regularity of retinal mosaics, particularly as a quantitative tool to understand development of the retina.
References
- ↑ Baddeley, Adrian. (25 November 2015). Spatial point patterns : methodology and applications with R. ISBN 978-1-4822-1020-0. OCLC 1041437183.
- ↑ Brandolini, Filippo; Carrer, Francesco (2020-03-13). "Terra, Silva et Paludes. Assessing the Role of Alluvial Geomorphology for Late-Holocene Settlement Strategies (Po Plain – N Italy) Through Point Pattern Analysis". Environmental Archaeology 26 (5): 511–525. doi:10.1080/14614103.2020.1740866. ISSN 1461-4103.
- ↑ Roth, Georg (2008) (in de). GEBEN UND NEHMEN. Eine wirtschaftshistorische Studie zum neolithischen Hornsteinbergbau von Abensberg-Arnhofen, Kr. Kelheim (Niederbayern). BAND I: Bergbau.. Köln: Universität Köln (published 2011). pp. 126-166. https://kups.ub.uni-koeln.de/4176/1/ROTH_Arnhofen_2008_Bd1_druck.pdf.
Further reading
- Cressie, N. A. C. and C. K. Wikle (2011) Statistics for spatio-temporal data. Hoboken, N.J., Wiley. ISBN 978-0-471-69274-4
 |
