Software:Statgraphics
 | |
| Developer(s) | Statgraphics Technologies, Inc. [1] |
|---|---|
| Initial release | 1980 |
| Stable release | 19.5.01
/ April, 2023 |
| Operating system | Windows |
| Type | Statistics Package |
| License | Proprietary |
| Website | statgraphics.com |
Statgraphics is a statistics package that performs and explains basic and advanced statistical functions.
History
The software was created in 1980 by Dr. Neil W. Polhemus while on the faculty at the Princeton University School of Engineering and Applied Science for use as a teaching tool for his statistics students. It was made available to the public in 1982, becoming and early example of data science software designed for use on the PC.
Software
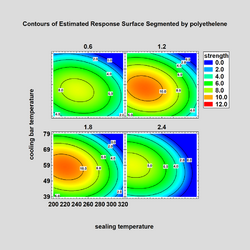
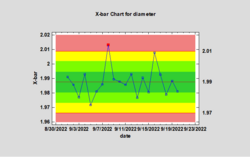
The flagship version of Statgraphics is Statgraphics Centurion, a Windows desktop application with capabilities for regression analysis, ANOVA, multivariate statistics, Design of Experiments, statistical process control, life data analysis, machine learning, and data visualization. The data analysis procedures include descriptive statistics, hypothesis testing, regression analysis, analysis of variance, survival analysis, time series analysis and forecasting, sample size determination, multivariate methods, machine learning and Monte Carlo techniques. The SPC menu includes many procedures for quality assessment, capability analysis, control charts, measurement systems analysis, and acceptance sampling. The program also features a DOE Wizard that creates and analyzes statistically designed experiments.
Applications
Statgraphics is frequently used for Six Sigma process improvement.[1] The program has also been used in various health and nutrition-related studies.[2][3][4] The software is heavily used in manufacturing chemicals, pharmaceuticals, medical devices, automobiles, food and consumer goods. It is also widely used in mining,[5] environmental studies,[6][7] and basic R&D.[8]
Distribution
Statgraphics is distributed by Statgraphics Technologies, Inc., a privately held company based in The Plains, Virginia.
See also
- List of statistical packages
- Comparison of statistical packages
- List of information graphics software
References
- ↑ "Statistical Software with Six Sigma - Free Online Library". http://www.thefreelibrary.com/Statistical+Software+with+Six+Sigma-a01073757206.
- ↑ "Recommendations for an educational programme to improve consumer knowledge of and attitudes towards nutritional information on food labels". http://www.saspen.com/2001/educational.htm.
- ↑ "British Journal of Nutrition - error". http://pt.wkhealth.com/pt/re/bjon/abstract.00002375-200407000-00006.htm;jsessionid=KJsMcG759pWFtDx7TX8bZ5QhGQhj03lYywMtrkww5hxQkLyQcq1W!1864410514!181195629!8091!-1. Retrieved 1 October 2017.
- ↑ Brieu, Nathalie; Guyon, Gaël; Rodière, Michel; Segondy, Michel; Foulongne, Vincent (1 November 2008). "Human Bocavirus Infection in Children With Respiratory Tract Disease". The Pediatric Infectious Disease Journal 27 (11): 969–973. doi:10.1097/INF.0b013e31817acfaa. PMID 18833027.
- ↑ Santander, Mario (September 2019). "Recovery of pyrite from copper tailings by flotation". Journal of Materials Research and Technology 8 (5): 4312–4317. doi:10.1016/j.jmrt.2019.07.041.
- ↑ Nuñez-Alonso, David (February 2019). "Statistical Tools for Air Pollution Assessment: Multivariate and Spatial Analysis Studies in the Madrid Region". Journal of Analytical Methods in Chemistry 2019: 9753927. doi:10.1155/2019/9753927. PMID 30881728.
- ↑ Dvorský, Ján (2017). "Comparison of Housing Construction Development in Selected Regions of Central Europe". IOP Conference Series: Earth and Environmental Science 95 (4): 042052. doi:10.1088/1755-1315/95/4/042052. Bibcode: 2017E&ES...95d2052D.
- ↑ Hosny, Khaled (June 2018). "Quality by design approach to optimize the formulation variables influencing the characteristics of biodegradable intramuscular in-situ gel loaded with alendronate sodium for osteoporosis". PLOS ONE 13 (6): e0197540. doi:10.1371/journal.pone.0197540. PMID 29856752. Bibcode: 2018PLoSO..1397540H.
 |


