Functional boxplot
In statistical graphics, the functional boxplot is an informative exploratory tool that has been proposed for visualizing functional data.[1][2] Analogous to the classical boxplot, the descriptive statistics of a functional boxplot are: the envelope of the 50% central region, the median curve and the maximum non-outlying envelope. To construct a functional boxplot, data ordering is the first step. In functional data analysis, each observation is a real function, therefore, different from the classical boxplot where data are simply ordered from the smallest sample value to the largest, in a functional boxplot, functional data, e.g. curves or images, are ordered by a notion of band depth or a modified band depth.[3] It allows for ordering functional data from the center outwards and, thus, introduces a measure to define functional quantiles and the centrality or outlyingness of an observation. Having the ranks of functional data, the functional boxplot is a natural extension of the classical boxplot.
Construction
In the classical boxplot, the box itself represents the middle 50% of the data. Since the data ordering in the functional boxplot is from the center outwards, the 50% central region is defined by the band delimited by the 50% of deepest, or the most central observations. The border of the 50% central region is defined as the envelope representing the box in a classical boxplot. Thus, this 50% central region is the analog to the "interquartile range" (IQR) and gives a useful indication of the spread of the central 50% of the curves. This is a robust range for interpretation because the 50% central region is not affected by outliers or extreme values, and gives a less biased visualization of the curves' spread. The observation in the box indicates the median, or the most central observation which is also a robust statistic to measure centrality.
The "whiskers" of the boxplot are the vertical lines of the plot extending from the box and indicating the maximum envelope of the dataset except the outliers.
Outlier detection
Outliers can be detected in a functional boxplot by the 1.5 times the 50% central region empirical rule, analogous to the 1.5 IQR empirical rule for classical boxplots. The fences are obtained by inflating the envelope of the 50% central region by 1.5 times the height of the 50% central region. Any observations outside the fences are flagged as potential outliers. When each observation is simply a point, the functional boxplot degenerates to a classical boxplot, and it is different from the pointwise boxplots.
Enhanced functional boxplot
By introducing the concept of central regions, the functional boxplot can be generalized to an enhanced functional boxplot where the 25% and 75% central regions are provided as well.
Surface boxplot
Spatio-temporal data can be viewed as a temporal curve at each spatial location, or a spatial surface at each time. In the latter case, a volume-based surface band depth can be used to order sample surfaces and leads to a three-dimensional surface boxplot with similar characteristics as the functional boxplots. Similarly, the fences are obtained by the 1.5 times the 50% central region rule. Any surface outside the fences are flagged as outlier candidates. The surface boxplot is a natural extension of the functional boxplot to R3.
Examples
-
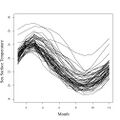 Data of monthly sea surface temperatures (SST) measured in degrees Celsius over the east-central tropical Pacific Ocean from 1951 to 2007.
 -
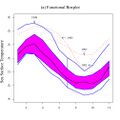 The functional boxplot of SST with blue curves denoting envelopes, and a black curve representing the median curve. The red dashed curves are the outlier candidates detected by the 1.5 times the 50% central region rule.
 -
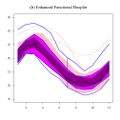 The enhanced functional boxplot of SST with dark magenta denoting the 25% central region, magenta representing the 50% central region and pink indicating the 75% central region.
 -
 The pointwise boxplots of SST with medians connected by a black line.
 -
 The surface boxplot with the box in the middle representing the 50% central region in R3, the middle surface inside the box denoting the median surface, and the upper and lower surfaces indicating the maximum non-outlying envelope.


Statistics code
The command fbplot for functional boxplots is in fda R package,[4] and MATLAB code is also available.
The Python library statsmodels makes functional boxplots available via the fboxplot function.[5] One could also use the boxplot function in scikit-fda package.[6]
See also
References
- ↑ Hyndman, Rob J.; Shang, Han Lin (2010). "Rainbow Plots, Bagplots, and Boxplots for Functional Data". Journal of Computational and Graphical Statistics 19 (1): 29–45. doi:10.1198/jcgs.2009.08158. http://www.buseco.monash.edu.au/ebs/pubs/wpapers/2008/wp9-08.pdf.
- ↑ Sun, Y.; Genton, M. G. (2011). "Functional boxplots". Journal of Computational and Graphical Statistics 20 (2): 316–334. doi:10.1198/jcgs.2011.09224.
- ↑ López-Pintado, S.; Romo, J. (2009). "On the Concept of Depth for Functional Data". Journal of the American Statistical Association 104 (486): 718–734. doi:10.1198/jasa.2009.0108.
- ↑ https://cran.r-project.org/web/packages/fda/fda.pdf fbplot help file.
- ↑ https://www.statsmodels.org/stable/generated/statsmodels.graphics.functional.fboxplot.html statsmodels documentation
- ↑ https://fda.readthedocs.io/en/latest/auto_examples/plot_boxplot.html scikit-fda functional boxplot example
 |  |
