Physics:Waterfall plot
From HandWiki
Short description: Data visualization technique

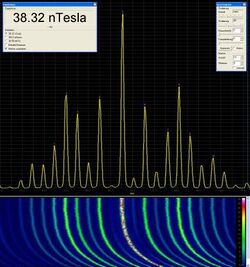
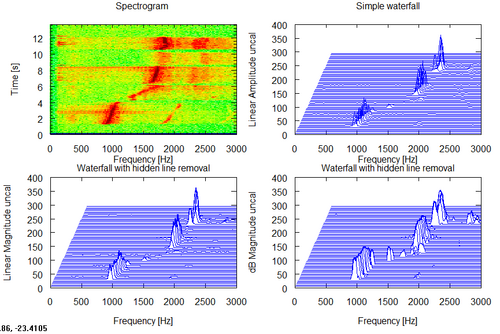
Waterfall plots are often used to show how two-dimensional phenomena change over time.[1] A three-dimensional spectral waterfall plot is a plot in which multiple curves of data, typically spectra, are displayed simultaneously. Typically the curves are staggered both across the screen and vertically, with "nearer" curves masking the ones behind. The result is a series of "mountain" shapes that appear to be side by side. The waterfall plot is often used to show how two-dimensional information changes over time or some other variable such as rotational speed. Waterfall plots are also often used to depict spectrograms or cumulative spectral decay[definition needed] (CSD).
Uses
- The results of spectral density estimation, showing the spectrum of the signal at successive intervals of time.
- The delayed response from a loudspeaker or listening room produced by impulse response testing or MLSSA.
- Spectra at different engine speeds when testing engines.


See also
References
External links
 |
