Earth:Sting jet
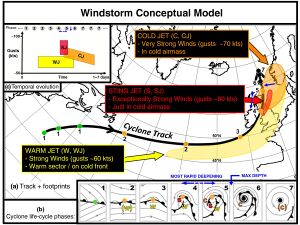
A sting jet is a narrow, transient and mesoscale airstream that descends from the mid-troposphere to the surface in some extratropical cyclones.[1] When present, sting jets produce some of the strongest surface-level winds in extratropical cyclones and can generate damaging wind gusts in excess of 50 m/s (180 km/h; 110 mph).[2][3][4] Sting jets are short-lived, lasting on the order of hours,[5] and the area subjected to their strong winds is typically no wider than 100 km (62 mi), making their effects highly localised. Studies have identified sting jets in mid-latitude cyclones primarily in the northern Atlantic and western Europe, though they may occur elsewhere. The storms that produce sting jets have tended to follow the Shapiro–Keyser model of extratropical cyclone development. Among these storms, sting jets tend to form following storm's highest rate of intensification.
Sting jets were first formally identified in 2004 by Keith Browning at the University of Reading in an analysis of the great storm of 1987, though forecasters have known of its effects since at least the late 1960s.[6] The sting jet emerges from within the end of an extratropical cyclone's cloud head – a hook-shaped region of cloudiness near the centre of low pressure – and accelerates as it descends to the surface. Multiple mechanisms explaining why sting jets form and why they accelerate during descent; frontolysis, the release of conditional symmetric instability, and evaporative cooling are often cited as influences on sting jet evolution. The presence of these factors can be used to forecast the jets themselves as sting jets are too small to be resolved by most globally-spanning weather models. The speed of the winds brought to the surface by a sting jet is dependent on the stability of the atmosphere within the layer of air near the surface. Sting jets can produce multiple areas of damaging winds, and a single cyclone can produce multiple sting jets.
Climatology and structure
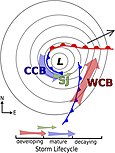
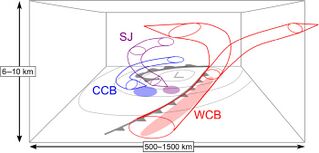
Sting jets are roughly 10–20 km (6–12 mi) wide and last 3–4 hours.[7] They are characterised in part by their mid-tropospheric origin and the acceleration of descending air, and are distinct from the low-tropospheric airstreams accompanying the cold and warm conveyor belts of extratropical cyclones.[8][9] Sting jets constitute one possible mechanism through which high winds can be produced in extratropical cyclones without being directly caused by atmospheric convection.[10]
Not all mid-latitude cyclones produce sting jets; in most cases, the strong surface winds found in extratropical cyclones are produced by the cold and warm conveyor belts.[9] One analysis suggested that 39–49% of the strongest extratropical cyclones in the North Atlantic exhibit them.[11] Nearly a third of the most intense windstorms affecting the United Kingdom from 1993 to 2013 produced sting jets.[12] Within the North Atlantic, cyclones developing sting jets tend to follow common storm tracks and originate south of 50°N, suggesting a potential influence of warm and moist air on sting jet formation.[13][14] Sting jet development also appears more likely for explosively intensifying storms.[15] Atmospheric reanalysis data suggest that sting jets are more common over water than over land,[13] but sting jets can develop entirely over continental land.[16] The increased moisture associated with climate change may amplify the atmospheric instabilities that support sting jet development, potentially increasing the proportion of extratropical cyclones with sting jets and their intensities.[17][18][19] The frequency of extreme windstorms and sting jets overall may also increase with climate change;[20] one study assessed a 60% increase in the occurrence of conducive conditions for sting jet development over the North Atlantic by 2100 if RCP8.5 is assumed.[21]
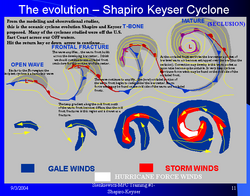
Sting jet-producing cyclones typically follow the evolution envisaged by the Shapiro–Keyser model.[22] In the four-stage model, a frontal fracture – a discrete separation of the cold front from the low-pressure centre – occurs during the development of an extratropical cyclone as the cold front moves perpendicular to the warm front.[23][6] In Shapiro–Keyser storms, the temperature contrast initially associated with the warm front wraps around the low-pressure centre, forming a back-bent front as the cyclone reaches its mature stage;[22] the most damaging extratropical cyclones exhibit these developmental signatures.[24] A hook-shaped cloud head aligned with the back-bent front is characteristic of storms producing sting jets.[3] The sting jet originates equatorward of the cyclone centre at the end of the back-bent front and near the tip of the cloud head following the frontal fracture stage of the Shapiro–Keyser model.[22][3] This tends to occur following the storm's fastest intensification and prior to the storm's peak intensity.[25] Meteorologist Keith Browning at the University of Reading formally identified sting jets in a paper published in 2004 analysing the intense winds associated with the Great Storm of October 1987.[26] His coinage of "sting jet" paid homage to the pioneering work of Norwegian meteorologists in the mid-20th century who likened the area of strong winds at the end of back-bent occlusions in storms affecting Norway to the "poisonous tail" of a scorpion.[22]
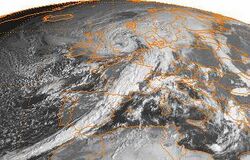
Sting jets may result in the clearing of clouds in the planetary boundary layer evident on satellite imagery past the tip of the cloud head.[2] Shallow arc- or chevron-shaped stratiform clouds in an extratropical cyclone's dry slot may also accompany sting jets,[27] and some of these cloud features may contribute directly to sting jet intensity.[28] However, conclusive identification of sting jets requires confirmation of the presence of a descending airstream,[2] and detection can be difficult with routine meteorological observations.[26] Most identifications of sting jets have been derived from the outputs numerical weather models.[29] Sting jets have been diagnosed in several windstorms over the eastern North Atlantic and western Europe, including the 1987 storm.[30][31] Research into sting jets outside of the northern Atlantic has been limited,[31] with case studies primarily focusing on European windstorms affecting the British Isles.[16] Nonetheless, the observed conditions that facilitate sting jet development are not unique to the northern Atlantic.[13] Sting jets may occur in northern Pacific windstorms,[32] but may be less significant for Pacific Northwest windstorm.[33] The first aerial in situ observations of a sting jet were taken in Cyclone Friedhelm in 2011 as part of the Diabatic Influences on Mesoscale Structures in Extratropical Storms (DIAMET) field campaign.[30]
Development
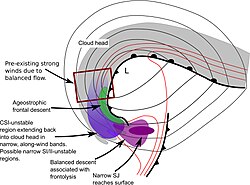
Sting jets emanate from the cloud head and descend into the corridor of dry air associated with mid-latitude cyclones.[3] The descending air begins in the mid-levels of the troposphere, between the 600 hPa and 800 hPa pressure levels.[8] The mechanisms that cause the initial descent of air and the acceleration of winds in the sting jet are not well-established,[1] with studies finding both supporting and refuting evidence for proposed mechanisms.[16] These qualities of sting jets may be influenced by both synoptic scale and mesoscale processes.[31] Sting jets descend from the mid-troposphere at a rate of roughly 10 cm/s (0.33 ft/s), reaching the surface over the course of several hours.[34] The descent may be triggered by strong frontolysis equatorward of the cyclone centre.[1] Warm air initially brought into the cyclone by the warm conveyor belt descends upon reaching the frontolytic region, providing one possible process through which sting jets develop. This region of frontolysis associated with the back-bent front is unique to Shapiro–Keyser storms.[34] The appearance of banded structures in the cloud head associated with sloped circulations with alternating regions of ascending and descending air – possibly indicative of the release of conditional symmetric instability (CSI) – may also play a direct role in sting jet development, with air sinking in one of the cloud head downdraughts.[35] The presence of filamentary cloud bands in the cloud head, separated by one or more cloud-free regions, indirectly suggests the possible presence of sting jets. The Met Office has used the appearance of bands in cloud heads to operationally forecast sting jets.[36] The slanted nature of the sting jet has also been observed in wind profiler observations.[37] The release of symmetric instability – a form of inertial instability independent of moisture – may also be implicated in sting jet formation.[38]
Sting jets do not derive their high wind speeds from the jet stream in the upper troposphere.[39] Instead, the air associated with the sting jet initially bears lower momentum in the mid-troposphere and accelerates as it descends.[1] The sting jet's rate of descent depends on the instability of the troposphere,[40] which in turn may be influenced by the local behaviour of water vapour, such as through evaporative cooling or the release of CSI.[1] Both of these processes may influence sting jet intensification in different phases.[41] The reduction in stability from evaporative cooling or fluxes of heat and moisture from the surface may enable faster vertical motions.[2] Water from showers associated with sloped updraughts within the cloud head or from higher clouds may fall into regions of descent,[35][6] evaporating and cooling the air as the sting jet moves into the dry frontal fracture zone.[42] The evaporating cooling can result in the decreased potential temperature and increased specific humidity characteristic of air in sting jets;[35] the increased density of the cooled air relative to the surrounding environment forces it to descend.[7] Alternatively, the acceleration of winds in the sting jet may be due to air encountering stronger pressure gradients while descending and rotating about the low pressure centre,[1][43] and damaging sting jet winds may be achievable without enhancement from evaporative cooling or CSI release.[44] In the Northern Hemisphere, the strongest pressure gradients in a Shapiro–Keyser cyclone are often in the southwestern part of the cyclone where sting jets are found.[45]
Air carried by the sting jet descends rapidly from the mid-troposphere.[35] The trajectory of a sting jet follows a sloped path of constant wet-bulb potential temperature.[8] Once it reaches the planetary boundary layer, atmospheric convection and turbulent mixing within that layer brings the high momentum associated with the accelerated airstream to the surface, generating the intense surface winds associated with sting jets.[35] The degree to which sting jet air reaches the surface is dependent on the stability of the boundary layer.[31] Compared to other regions in mid-latitude cyclones, the frontal-fracture region into which sting jets descend is more neutrally stable to convection, enabling strong gusts to more efficiently reach the surface.[46] Destabilisation of the air at the top of the boundary layer may also prompt sting jet descent.[47] However, the boundary layer stability may be sufficiently high in some cases to prevent the descending sting jet from reaching the surface.[31] The imprint of sting jets may be evident as a locally intense region of surface wind speeds, though such maxima may arise from the combination of both sting jets and the cold air wrapping around a low-pressure area (the cold conveyor belt).[2] While the sting jet originates above the cold conveyor belt, it may descend to the surface ahead of the tip of the cold conveyor belt to produce a distinct region of intense winds,[5] or augment the pre-existing winds in the cold conveyor belt;[17] both circumstances may occur during a cyclone's lifecycle.[48] The swath of damaging winds produced by sting jets is narrower than 100 km (62 mi) in width.[46] Multiple sting jets may be simultaneously present within a cyclone, and a single sting jet may produce multiple wind maxima.[30]
Forecasting and modelling
The features of extratropical cyclones observable on satellite imagery and ascribable to sting jets are only evident when sting jets are imminent or already in progress. Longer range forecasts of sting jets rely on gauging whether or not the broader environmental conditions favour the development of a Shapiro–Keyser cyclone.[49] Sting jets can be reproduced in atmospheric models, but sufficiently high spatial resolution is necessary to resolve the mesoscale sting jet.[50] The horizontal spacing of model grid cells must be smaller than about 10–15 km (6.2–9.3 mi) to depict sting jets, and finer resolutions are needed to resolve localised details.[51] These can be used by forecasters; however, the scale of sting jets is near the limits of the resolution of longer-range global numerical weather prediction models, making ensemble forecasting through the use of their explicit appearance in global model outputs impractical.[49] Difficulties with parameterising the planetary boundary layer also lead to difficulties with depicting sting jets in computer models.[25]
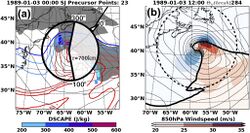
As a proxy for direct modelling of sting jets, the relationship between CSI and sting jets may be leveraged to identify "sting jet precursors": properties of cyclones likely to generate sting jets.[49] The potential for CSI to enhance the descent of sting jets is quantified by downdraught slantwise convective available potential energy (DSCAPE), which measures the theoretical maximum kinetic energy that a descending air parcel may attain while remaining saturated and conserving geostrophic absolute momentum.[52][lower-alpha 1] A method for identifying sting jet precursors in low-resolution data was published in Meteorological Applications in 2013, proposing that precursors featured high DSCAPE (exceeding 200 J kg−1) for air parcels descending from the mid-troposphere within the frontal fracture zone and less than 80 percent relative humidity.[54] Bsed on this algorithm, the University of Reading developed a forecasting aid in use by the Met Office highlighting sting jet precursors based on the presence of sufficiently high DSCAPE in the cloud head of modelled cyclones.[52]
See also
Notes
- ↑ Geostrophic absolute momentum is defined as [math]\displaystyle{ M_g = v_g + fx }[/math], where [math]\displaystyle{ v_g }[/math] is the component of geostrophic wind perpendicular to the temperature gradient, [math]\displaystyle{ f }[/math] is the Coriolis parameter, and [math]\displaystyle{ x }[/math] is the position along a coordinate axis aligned with the temperature gradient, such that [math]\displaystyle{ x }[/math] increases in the direction of warmer air.[53]
References
- ↑ 1.0 1.1 1.2 1.3 1.4 1.5 Schultz & Browning 2017, pp. 63–64.
- ↑ 2.0 2.1 2.2 2.3 2.4 Schultz & Browning 2017, p. 65.
- ↑ 3.0 3.1 3.2 3.3 Baker 2009, p. 143.
- ↑ Gliksman et al. 2023, p. 2174.
- ↑ 5.0 5.1 Clark & Gray 2018, p. 967.
- ↑ 6.0 6.1 6.2 Martínez-Alvarado, Weidle & Gray 2010, p. 4055.
- ↑ 7.0 7.1 Slawson, Nicola (18 February 2022). "What is a 'sting jet'? Scientists warn of repeat of 1987 phenomenon". The Guardian. https://www.theguardian.com/uk-news/2022/feb/18/storm-eunice-could-create-sting-jet-similar-to-great-storm-of-1987.
- ↑ 8.0 8.1 8.2 Baker, Gray & Clark 2014, p. 97.
- ↑ 9.0 9.1 Gray et al. 2021, p. 369.
- ↑ Knox et al. 2011, p. 63.
- ↑ Schultz & Browning 2017, pp. 64.
- ↑ "What is a sting jet?". Royal Meteorological Society. https://www.rmets.org/metmatters/what-sting-jet.
- ↑ 13.0 13.1 13.2 Clark & Gray 2018, p. 964.
- ↑ Martínez-Alvarado et al. 2012, p. 7.
- ↑ Hart, Gray & Clark 2017, p. 5468.
- ↑ 16.0 16.1 16.2 Eisenstein, Pantillon & Knippertz 2020, p. 187.
- ↑ 17.0 17.1 Martínez‐Alvarado et al. 2018, p. 1.
- ↑ Knippertz, Pantillon & Fink 2018.
- ↑ Little, Priestley & Catto 2023, p. 1.
- ↑ Manning et al. 2022, p. 2402.
- ↑ Catto et al. 2019, p. 413.
- ↑ 22.0 22.1 22.2 22.3 Schultz & Browning 2017, p. 63.
- ↑ Clark & Gray 2018, p. 945.
- ↑ Browning 2004, p. 375.
- ↑ 25.0 25.1 Hewson & Neu 2015, p. 10.
- ↑ 26.0 26.1 Clark & Gray 2018, p. 944.
- ↑ Browning & Field 2004, p. 287.
- ↑ Browning et al. 2015, p. 2970.
- ↑ Clark & Gray 2018, p. 953.
- ↑ 30.0 30.1 30.2 Clark & Gray 2018, p. 950.
- ↑ 31.0 31.1 31.2 31.3 31.4 Clark & Gray 2018, p. 966.
- ↑ Pichugin, Gurvich & Baranyuk 2023, p. 1.
- ↑ Mass & Dotson 2010, p. 2526.
- ↑ 34.0 34.1 Schultz & Sienkiewicz 2013, pp. 607–611.
- ↑ 35.0 35.1 35.2 35.3 35.4 Baker 2009, p. 144.
- ↑ Clark & Gray 2018, p. 952.
- ↑ Parton et al. 2009, p. 663.
- ↑ Clark & Gray 2018, p. 961.
- ↑ Clark & Gray 2018, p. 965.
- ↑ Baker, Gray & Clark 2014, p. 96.
- ↑ Volonté, Clark & Gray 2018, p. 896.
- ↑ Gray et al. 2011, p. 1499.
- ↑ "The Sting Jet". EUMeTrain. 2020. https://www.theguardian.com/uk-news/2022/feb/18/storm-eunice-could-create-sting-jet-similar-to-great-storm-of-1987.
- ↑ Smart & Browning 2014, p. 609.
- ↑ Clark & Gray 2018, p. 958.
- ↑ 46.0 46.1 Clark & Gray 2018, p. 963.
- ↑ Rivière, Ricard & Arbogast 2020, p. 1819.
- ↑ Martínez-Alvarado et al. 2014, p. 2593.
- ↑ 49.0 49.1 49.2 Gray et al. 2021, p. 370.
- ↑ Coronel et al. 2016, p. 1781.
- ↑ Clark & Gray 2018, p. 955.
- ↑ 52.0 52.1 Gray et al. 2021, pp. 370–371.
- ↑ Schultz & Schumacher 1999, p. 2712.
- ↑ Martínez‐Alvarado et al. 2013, pp. 52–53.
Sources
- Baker, Laura (June 2009). "Sting jets in severe northern European wind storms". Weather 64 (6): 143–148. doi:10.1002/wea.397. Bibcode: 2009Wthr...64..143B.
- Baker, L. H.; Gray, S. L.; Clark, P. A. (January 2014). "Idealised simulations of sting-jet cyclones". Quarterly Journal of the Royal Meteorological Society 140 (678): 96–110. doi:10.1002/qj.2131. Bibcode: 2014QJRMS.140...96B. https://centaur.reading.ac.uk/33269/1/2131_ftp.pdf.
- Browning, K. A. (January 2004). "The sting at the end of the tail: Damaging winds associated with extratropical cyclones". Quarterly Journal of the Royal Meteorological Society 130 (597): 375–399. doi:10.1256/qj.02.143. Bibcode: 2004QJRMS.130..375B.
- Browning, K. A.; Field, M. (December 2004). "Evidence from Meteosat imagery of the interaction of sting jets with the boundary layer". Meteorological Applications 11 (4): 277–289. doi:10.1017/S1350482704001379. Bibcode: 2004MeApp..11..277B. https://centaur.reading.ac.uk/35115/1/200411401_ftp.pdf.
- Browning, K. A.; Smart, D. J.; Clark, M. R.; Illingworth, A. J. (October 2015). "The role of evaporating showers in the transfer of sting-jet momentum to the surface". Quarterly Journal of the Royal Meteorological Society 141 (693): 2956–2971. doi:10.1002/qj.2581. Bibcode: 2015QJRMS.141.2956B.
- Catto, Jennifer L.; Ackerley, Duncan; Booth, James F.; Champion, Adrian J.; Colle, Brian A.; Pfahl, Stephan; Pinto, Joaquim G.; Quinting, Julian F. et al. (December 2019). "The Future of Midlatitude Cyclones". Current Climate Change Reports 5 (4): 407–420. doi:10.1007/s40641-019-00149-4. Bibcode: 2019CCCR....5..407C.
- Clark, Peter A.; Gray, Suzanne L. (April 2018). "Sting jets in extratropical cyclones: a review". Quarterly Journal of the Royal Meteorological Society 144 (713): 943–969. doi:10.1002/qj.3267. Bibcode: 2018QJRMS.144..943C.
- Coronel, B.; Ricard, D.; Rivière, G.; Arbogast, P. (April 2016). "Cold-conveyor-belt jet, sting jet and slantwise circulations in idealized simulations of extratropical cyclones". Quarterly Journal of the Royal Meteorological Society 142 (697): 1781–1796. doi:10.1002/qj.2775. Bibcode: 2016QJRMS.142.1781C.
- Eisenstein, Lea; Pantillon, Florian; Knippertz, Peter (January 2020). "Dynamics of sting-jet storm Egon over continental Europe: Impact of surface properties and model resolution". Quarterly Journal of the Royal Meteorological Society 146 (726): 186–210. doi:10.1002/qj.3666. Bibcode: 2020QJRMS.146..186E.
- Gliksman, Daniel; Averbeck, Paul; Becker, Nico; Gardiner, Barry; Goldberg, Valeri; Grieger, Jens; Handorf, Dörthe; Haustein, Karsten et al. (16 June 2023). "Review article: A European perspective on wind and storm damage – from the meteorological background to index-based approaches to assess impacts". Natural Hazards and Earth System Sciences 23 (6): 2171–2201. doi:10.5194/nhess-23-2171-2023. Bibcode: 2023NHESS..23.2171G.
- Gray, S. L.; Martínez-Alvarado, O.; Baker, L. H.; Clark, P. A. (July 2011). "Conditional symmetric instability in sting-jet storms". Quarterly Journal of the Royal Meteorological Society 137 (659): 1482–1500. doi:10.1002/qj.859. Bibcode: 2011QJRMS.137.1482G.
- Gray, Suzanne L.; Martínez-Alvarado, Oscar; Ackerley, Duncan; Suri, Dan (November 2021). "Development of a prototype real-time sting-jet precursor tool for forecasters". Weather 76 (11): 369–373. doi:10.1002/wea.3889. Bibcode: 2021Wthr...76..369G.
- Hart, Neil C. G.; Gray, Suzanne L.; Clark, Peter A. (July 2017). "Sting-Jet Windstorms over the North Atlantic: Climatology and Contribution to Extreme Wind Risk". Journal of Climate 30 (14): 5455–5471. doi:10.1175/JCLI-D-16-0791.1. Bibcode: 2017JCli...30.5455H.
- Hewson, Tim D.; Neu, Urs (1 December 2015). "Cyclones, windstorms and the IMILAST project". Tellus A: Dynamic Meteorology and Oceanography 67 (1): 27128. doi:10.3402/tellusa.v67.27128. Bibcode: 2015TellA..6727128H.
- Knippertz, Peter; Pantillon, Florian; Fink, Andreas H. (1 May 2018). "The devil in the detail of storms". Environmental Research Letters 13 (5): 051001. doi:10.1088/1748-9326/aabd3e. Bibcode: 2018ERL....13e1001K.
- Knox, John A.; Frye, John D.; Durkee, Joshua D.; Fuhrmann, Christopher M. (February 2011). "Non-Convective High Winds Associated with Extratropical Cyclones: Non-convective high winds with extratropical cyclones". Geography Compass 5 (2): 63–89. doi:10.1111/j.1749-8198.2010.00395.x.
- Little, Alexander S.; Priestley, Matthew D. K.; Catto, Jennifer L. (22 July 2023). "Future increased risk from extratropical windstorms in northern Europe". Nature Communications 14 (1): 4434. doi:10.1038/s41467-023-40102-6. PMID 37481655. Bibcode: 2023NatCo..14.4434L.
- Manning, Colin; Kendon, Elizabeth J.; Fowler, Hayley J.; Roberts, Nigel M.; Berthou, Ségolène; Suri, Dan; Roberts, Malcolm J. (May 2022). "Extreme windstorms and sting jets in convection-permitting climate simulations over Europe". Climate Dynamics 58 (9–10): 2387–2404. doi:10.1007/s00382-021-06011-4. Bibcode: 2022ClDy...58.2387M.
- Martínez-Alvarado, Oscar; Gray, Suzanne L.; Clark, Peter A.; Baker, Laura H. (March 2013). "Objective detection of sting jets in low-resolution datasets". Meteorological Applications 20 (1): 41–55. doi:10.1002/met.297. Bibcode: 2013MeApp..20...41M.
- Martínez-Alvarado, Oscar; Gray, Suzanne L; Catto, Jennifer L; Clark, Peter A (1 June 2012). "Sting jets in intense winter North-Atlantic windstorms". Environmental Research Letters 7 (2): 024014. doi:10.1088/1748-9326/7/2/024014. Bibcode: 2012ERL.....7b4014M.
- Martínez-Alvarado, Oscar; Baker, Laura H.; Gray, Suzanne L.; Methven, John; Plant, Robert S. (1 August 2014). "Distinguishing the Cold Conveyor Belt and Sting Jet Airstreams in an Intense Extratropical Cyclone". Monthly Weather Review 142 (8): 2571–2595. doi:10.1175/MWR-D-13-00348.1. Bibcode: 2014MWRv..142.2571M.
- Martínez-Alvarado, Oscar; Gray, Suzanne L; Hart, Neil C G; Clark, Peter A; Hodges, Kevin; Roberts, Malcolm J (1 April 2018). "Increased wind risk from sting-jet windstorms with climate change". Environmental Research Letters 13 (4): 044002. doi:10.1088/1748-9326/aaae3a. Bibcode: 2018ERL....13d4002M.
- Mass, Clifford; Dotson, Brigid (1 July 2010). "Major Extratropical Cyclones of the Northwest United States: Historical Review, Climatology, and Synoptic Environment". Monthly Weather Review 138 (7): 2499–2527. doi:10.1175/2010MWR3213.1. Bibcode: 2010MWRv..138.2499M.
- Parton, G. A.; Vaughan, G.; Norton, E. G.; Browning, K. A.; Clark, P. A. (April 2009). "Wind profiler observations of a sting jet". Quarterly Journal of the Royal Meteorological Society 135 (640): 663–680. doi:10.1002/qj.398. Bibcode: 2009QJRMS.135..663P.
- Pichugin, Mikhail; Gurvich, Irina; Baranyuk, Anastasiya (30 October 2023). "Assessment of Extreme Ocean Winds within Intense Wintertime Windstorms over the North Pacific Using SMAP L-Band Radiometer Observations". Remote Sensing 15 (21): 5181. doi:10.3390/rs15215181. Bibcode: 2023RemS...15.5181P.
- Rivière, Gwendal; Ricard, Didier; Arbogast, Philippe (April 2020). "The downward transport of momentum to the surface in idealized sting-jet cyclones". Quarterly Journal of the Royal Meteorological Society 146 (729): 1801–1821. doi:10.1002/qj.3767. Bibcode: 2020QJRMS.146.1801R. https://hal.science/hal-02920016.
- Schultz, David M.; Sienkiewicz, Joseph M. (1 June 2013). "Using Frontogenesis to Identify Sting Jets in Extratropical Cyclones". Weather and Forecasting 28 (3): 603–613. doi:10.1175/WAF-D-12-00126.1. Bibcode: 2013WtFor..28..603S.
- Schultz, David M.; Schumacher, Philip N. (December 1999). "The Use and Misuse of Conditional Symmetric Instability". Monthly Weather Review 127 (12): 2709–2732. doi:10.1175/1520-0493(1999)127<2709:TUAMOC>2.0.CO;2.
- Schultz, David M.; Browning, Keith A. (March 2017). "What is a sting jet?". Weather 72 (3): 63–66. doi:10.1002/wea.2795. Bibcode: 2017Wthr...72...63S.
- Smart, D. J.; Browning, K. A. (January 2014). "Attribution of strong winds to a cold conveyor belt and sting jet". Quarterly Journal of the Royal Meteorological Society 140 (679): 595–610. doi:10.1002/qj.2162. Bibcode: 2014QJRMS.140..595S.
- Volonté, Ambrogio; Clark, Peter A.; Gray, Suzanne L. (April 2018). "The role of mesoscale instabilities in the sting-jet dynamics of windstorm Tini". Quarterly Journal of the Royal Meteorological Society 144 (712): 877–899. doi:10.1002/qj.3264. Bibcode: 2018QJRMS.144..877V.
 |
