Buddhabrot
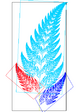
The Buddhabrot is the probability distribution over the trajectories of points that escape the Mandelbrot fractal. Its name reflects its pareidolic resemblance to classical depictions of Gautama Buddha, seated in a meditation pose with a forehead mark (tika), a traditional oval crown (ushnisha), and ringlet of hair.
Discovery
The Buddhabrot rendering technique was discovered by Melinda Green,[1] who later described it in a 1993 Usenet post to sci.fractals.[2]
Previous researchers had come very close to finding the precise Buddhabrot technique. In 1988, Linas Vepstas relayed similar images[3] to Cliff Pickover for inclusion in Pickover's then-forthcoming book Computers, Pattern, Chaos, and Beauty. This led directly to the discovery of Pickover stalks. Noel Griffin also implemented this idea in the 1993 "Mandelcloud" option in the Fractint renderer. However, these researchers did not filter out non-escaping trajectories required to produce the ghostly forms reminiscent of Hindu art. The inverse, "Anti-Buddhabrot" filter produces images similar to no filtering. An "Anti-Buddhabrot" is simply a Buddhabrot where only points that don't escape contribute to the image.
Green first named this pattern Ganesh, since an Indian co-worker "instantly recognized it as the god 'Ganesha' which is the one with the head of an elephant."[2] The name Buddhabrot was coined later by Lori Gardi.[4]
Rendering method


Mathematically, the Mandelbrot set consists of the set of points in the complex plane for which the iteratively defined sequence
does not tend to infinity as goes to infinity for .
.png)
The Buddhabrot image can be constructed by first creating a 2-dimensional array of boxes, each corresponding to a final pixel in the image. Each box for and has size in complex coordinates of and , where and for an image of width and height . For each box, a corresponding counter is initialized to zero. Next, a random sampling of points are iterated through the Mandelbrot function. For points which do escape within a chosen maximum number of iterations, and therefore are not in the Mandelbrot set, the counter for each box entered during the escape to infinity is incremented by 1. In other words, for each sequence corresponding to that escapes, for each point during the escape, the box that lies within is incremented by 1. Points which do not escape within the maximum number of iterations (and considered to be in the Mandelbrot set) are discarded. After a large number of values have been iterated, grayscale shades are then chosen based on the distribution of values recorded in the array. The result is a density plot highlighting regions where values spend the most time on their way to infinity.


Nuances
Rendering Buddhabrot images is typically more computationally intensive than standard Mandelbrot rendering techniques. This is partly due to requiring more random points to be iterated than pixels in the image in order to build up a sharp image. Rendering highly zoomed areas requires even more computation than for standard Mandelbrot images in which a given pixel can be computed directly regardless of zoom level. Conversely, a pixel in a zoomed region of a Buddhabrot image can be affected by initial points from regions far outside the one being rendered. Without resorting to more complex probabilistic techniques,[5] rendering zoomed portions of Buddhabrot consists of merely cropping a large full sized rendering.
The maximum number of iterations chosen affects the image – higher values give sparser, more detailed appearance, as a few of the points pass through a large number of pixels before they escape, resulting in their paths being more prominent. If a lower maximum was used, these points would not escape in time and would be regarded as not escaping at all. The number of samples chosen also affects the image as not only do higher sample counts reduce the noise of the image, they can reduce the visibility of slowly moving points and small attractors, which can show up as visible streaks in a rendering of lower sample count. Some of these streaks are visible in the 1,000,000 iteration image below. Some people may even include a minimum number of iterations, where a given sample is only used if it doesn't escape before a given number of iterations, to generate more of these intricate details.
Green later realized that this provided a natural way to create color Buddhabrot images by taking three such grayscale images, differing only by the maximum number of iterations used, and combining them into a single color image using the same method used by astronomers to create false color images of nebula and other celestial objects. For example, one could assign a 2,000 max iteration image to the red channel, a 200 max iteration image to the green channel, and a 20 max iteration image to the blue channel of an image in an RGB color space. Some have labelled Buddhabrot images using this technique Nebulabrots.


Relation to the logistic map


The relationship between the Mandelbrot set as defined by the iteration , and the logistic map is well known. The two are related by the quadratic transformation:
The traditional way of illustrating this relationship is aligning the logistic map and the Mandelbrot set through the relation between and , using a common x-axis and a different y-axis, showing a one-dimensional relationship.
Melinda Green discovered that the Anti-Buddhabrot paradigm fully integrates the logistic map. Both are based on tracing paths from non-escaping points, iterated from a (random) starting point, and the iteration functions are related by the transformation given above. It is then easy to see that the Anti-Buddhabrot for , plotting paths with and , simply generates the logistic map in the plane , when using the given transformation. For rendering purposes we use . In the logistic map, all ultimately generate the same path.
Because both the Mandelbrot set and the logistic map are an integral part of the Anti-Buddhabrot we can now show a 3D relationship between both, using the 3D axes . The animation shows the classic Anti-Buddhabrot with and , this is the 2D Mandelbrot set in the plane , and also the Anti-Buddhabrot with and , this is the 2D logistic map in the plane . We rotate the plane around the -axis, first showing , then rotating 90° to show , then rotating an extra 90° to show . We could rotate an extra 180° but this gives the same images, mirrored around the -axis.
The logistic map Anti-Buddhabrot is in fact a subset of the classic Anti-Buddhabrot, situated in the plane
(or
) of 3D
, perpendicular to the plane
. We emphasize this by showing briefly, at 90° rotation, only the projected plane
, not 'disturbed' by the projections of the planes with non-zero
.
References
- ↑ Melinda Green. "The Buddhabrot Technique", superliminal.com.
- ↑ 2.0 2.1 Daniel Green. "The deity hiding in the m-set", Groups.Google.com.
- ↑ "Interior Sketchbook Diary", Linas.org.
- ↑ Western News: The University of Western Ontario’s newspaper. Chaos (theory) rules for software developer.
- ↑ "The Buddhabrot". http://www.steckles.com/buddha/.
External links
| Wikimedia Commons has media related to Buddhabrot. |
- Lobo, Albert. "Meet the Buddhabrot technique". http://www.moleculardensity.net/buddhabrot/article/1.
- Mathologer (4 March 2016). "The dark side of the Mandelbrot set". https://www.youtube.com/watch?v=9gk_8mQuerg.
Characteristics 

Iterated function
systemStrange attractor L-system Escape-time
fractalsRendering techniques Random fractals People Other Patterns 
Causes People Related Concepts 
Forms Artworks Buildings Artists Theorists Ancient Renaissance - Luca Pacioli
- Piero della Francesca
- Leon Battista Alberti
- Sebastiano Serlio
- Regole generali d'architettura
- Andrea Palladio
- Albrecht Dürer
- Vier Bücher von Menschlicher Proportion
Romantic - Frederik Macody Lund
- "Ad Quadratum"
- Jay Hambidge
- "The Greek Vase"
- Samuel Colman
- "Nature's Harmonic Unity"
Modern - Owen Jones
- Ernest Hanbury Hankin
- The Drawing of Geometric Patterns in Saracenic Art
- G. H. Hardy
- George David Birkhoff
- Aesthetic Measure
- Douglas Hofstadter
- Nikos Salingaros
- The 'Life' of a Carpet
Publications Organizations Related topics
 Original source: https://en.wikipedia.org/wiki/Buddhabrot. Read more


.jpg)
.jpg)
